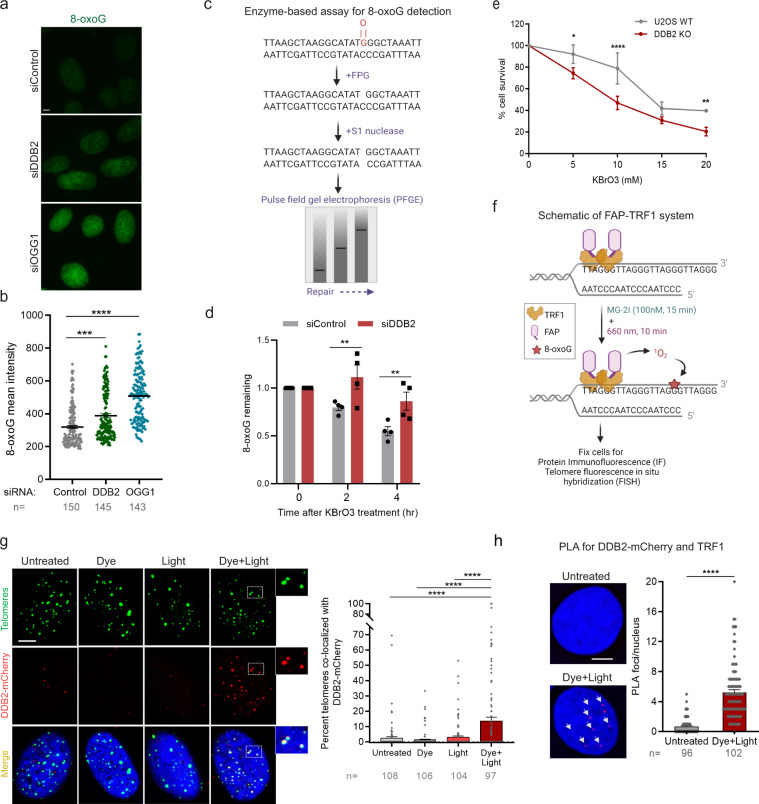
Fig. 1. DDB2 facilitates 8-oxoG repair and is rapidly recruited to sites of 8-oxoG within telomeric DNA.
a, b Immunofluorescence and quantification of 8-oxoG in cells transfected with control, DDB2 or OGG1 siRNA. c Schematic of the repair enzyme-based assay for 8-oxoG quantification in DNA. Genomic DNA containing 8-oxoG is treated with FPG to convert 8-oxoG to one nucleotide gaps. Treating with S1 nuclease converts the gaps to double stranded breaks (DSBs). The cleaved DNA is subjected to pulse field gel electrophoresis (PFGE) to track repair, as damaged DNA migrates faster than repaired DNA. d Quantification of 8-oxoG repair in U2OS cells transfected with control or DDB2 siRNA and treated with KBrO3. e Clonogenic cell survival curves in U2OS WT and DDB2 knockout (KO) cells treated with a range of concentrations of KBrO3. f Schematic of dye plus light treatment. Cells stably expressing FAP-TRF1 were treated with dye (100 nM, 15 min) plus light (660 nm, 10 min) to introduce 8-oxoG lesions at telomeres. g (left) Recruitment of DDB2-mCherry to 8-oxoG sites at telomeres in untreated, dye alone, light alone, and dye plus light treated cells. (right) Percentage telomeres colocalized with DDB2-mCherry. h Proximity ligation assay (PLA) for DDB2-mCherry and TRF1 in untreated cells and cells treated with dye (100 nM, 15 min) plus light (660 nm, 10 min). Data (a, b, d, g, h) represent mean ± SEM from two to three independent experiments. “n” represents the number of cells scored for each condition. Data (e) shows one representative experiment (performed in triplicate) from three independent experiments, mean ± SD. One-way ANOVA (Sidak multiple comparison test) (b, g), Student’s two-tailed Student’s t-test (h) and two-way ANOVA (Sidak multiple comparison test) (d, e) were performed for statistical analysis: *p < 0.05, **p < 0.01, ****p < 0.0001, ns Not significant. Scale: 5 µm. Source data are provided as a Source Data file. (See also Supplementary Fig. 1 and 2).

