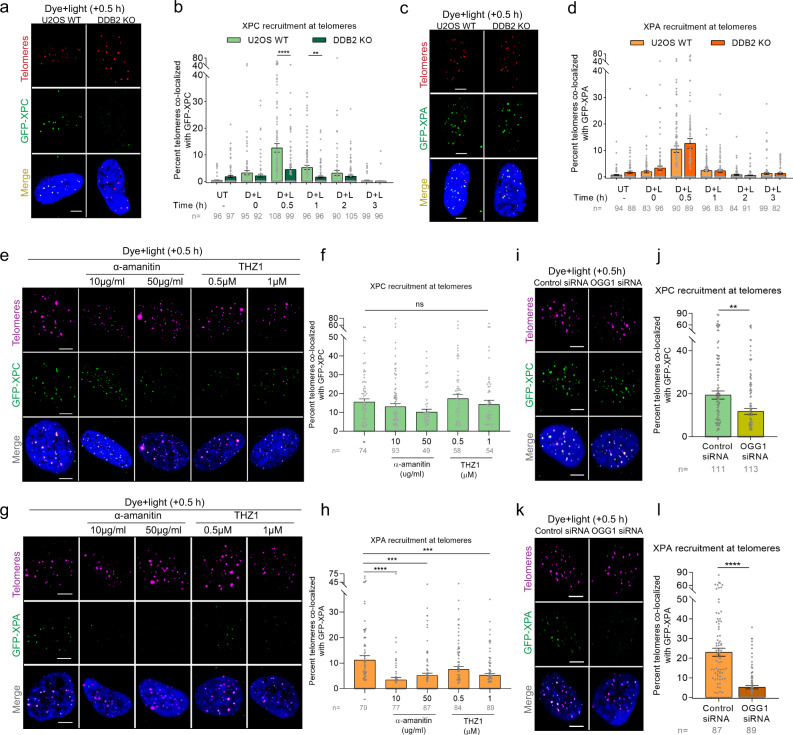
Fig. 3. DDB2 recruits XPC to telomeric 8-oxoG, while XPA recruitment is transcription-coupled and independent of DDB2.
a, c Representative images showing recruitment of GFP-XPC (a) or GFP-XPA (c) to 8-oxoG at telomeres after dye (100 nM, 15 min) plus light (660 nm, 10 min) treatment in U2OS WT and DDB2 KO cells, 30 min post treatment. b, d Percentage telomeres colocalized with GFP-XPC (b) or GFP-XPA (d) after treatment, over a period of 3 h. e, g Representative images of GFP-XPC (e) or GFP-XPA (g) accumulation at damaged telomeres 30 min after dye plus light treatment in cells pretreated with transcription inhibitors α-amanitin and THZ1. f, h Quantification of e (f) and g (h). i, j Colocalization of GFP-XPC with telomeres after dye plus light treatment in U2OS-FAP-TRF1 cells transfected with control or OGG1 siRNA. k, l Colocalization of GFP-XPA with telomeres after dye plus light treatment in U2OS-FAP-TRF1 cells transfected with control or OGG1 siRNA. Data (a–l) represents mean ± SEM from two independent experiments. “n” represents the number of cells scored for each condition. One-way ANOVA (Sidak multiple comparison test) (b, d, f, h) and Student’s two-tailed t-test (j, l): **p < 0.01; ***p < 0.001; ****p < 0.0001. Scale: 5 µm. Source data are provided as a Source Data file. (See also Supplementary Fig. 4).

