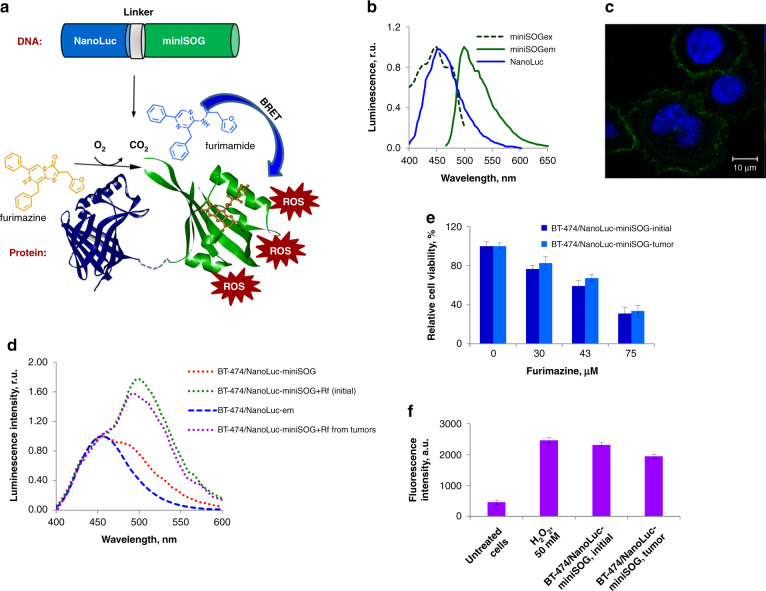
Fig. 1. NanoLuc-miniSOG platform for genetically encoded BRET-activated PDT.
a Schematic presentation of the concept. NanoLuc luciferase is fused to miniSOG phototoxic protein at genetic level. The energy generated by luciferase-substrate furimazine upon its oxidation by NanoLuc is nonradiatively transferred to miniSOG resulting in its excitation and generation of ROS, which in turn kill cancer cells. b Normalized emission spectrum of oxidized NanoLuc substrate (NanoLuc, blue line), normalized excitation (mSOGex, green dotted line) and emission (mSOGem, green line) spectra of miniSOG. c Confocal microphotograph of BT-474-based stable cell line with NanoLuc-miniSOG located in the plasma membrane. Fluorescence signals in green (miniSOG) and blue (Hoechst 33342) channels are presented. d Normalized emission spectra of BT-474/NanoLuc-mem (blue dotted line) and BT-474/NanoLuc-miniSOG-mem initial cell lines (green dotted line) and BT-474/NanoLuc-miniSOG isolated from the tumor (magenta dotted line) in the presence of 75 μM furimazine and riboflavine and BT-474/NanoLuc-miniSOG in the absence of riboflavin (red dotted line). e In vitro cytotoxicity studies of NanoLuc-miniSOG activated by BRET. The data of MTT assay are presented for BT-474/NanoLuc-miniSOG initial cell line and BT-474/NanoLuc-miniSOG from the tumor in the presence of different furimazine concentration. The data are shown as the mean ± SD (n = 3). f ROS production in NanoLuc-miniSOG BRET-activated system. Fluorescence intensity of DCF, an indicator of ROS, in BT-474/NanoLuc-miniSOG initial cell line and BT-474/NanoLuc-miniSOG from the tumor in the presence of 75 μM furimazine are presented. The measurement performed at 529 nm. The data are shown as ±SD (n = 3)

