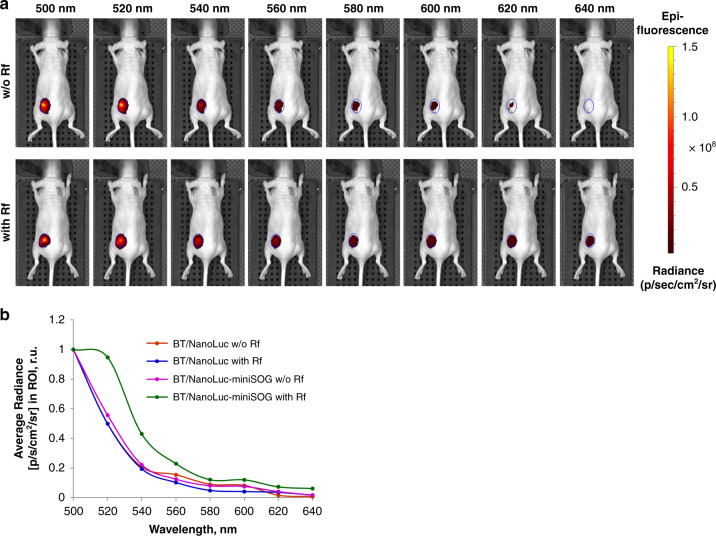
Fig. 3. Evidence of NanoLuc-mediated BRET effect in vivo.
a Fluorescence images of NanoLuc-miniSOG-tumor-bearing animals. Photos are performed after i.v. furimazine administration without (top row) and with (bottom row) Rf pre-injection. The ROI are indicated as a blue-circled area. b Normalized fluorescence intensity curves (in photons per second per cm2 per steradian) from the tumor region measured with and without RF pre-injection for mice bearing NanoLuc (blue and red curves, respectively) or NanoLuc-miniSOG-expressing tumors (green and magenta curves, respectively)

