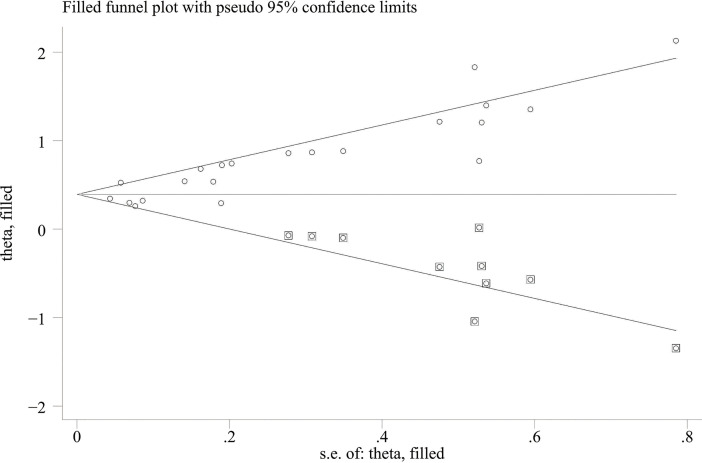
Figure 3.
Trimming chart of univariate analysis outcomes of baseline CRP levels and OS [round dots = the observed studies, square dots = the missing studies imputed by the trim–and–fill method, solid lines that create a triangular area indicate the 95% CI (under the fixed–effect model), and the horizontal solid line represents the overall effect size.

