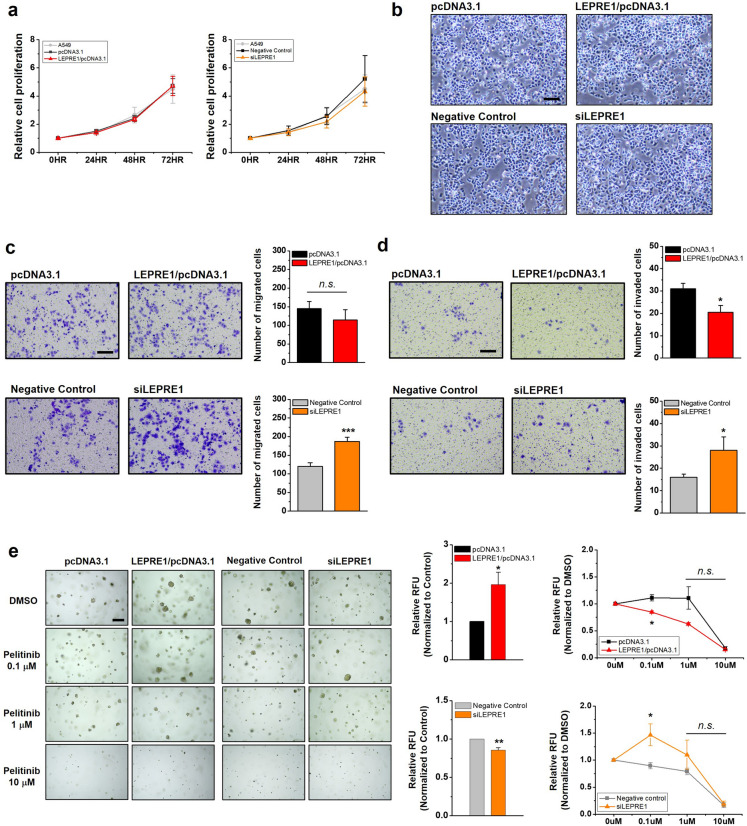
Figure 5.
LEPRE1 affects cell morphology, migration/invasion, and colonization in lung cancer-derived A549 cells. (a) Comparison of cell growth in parental or transfected (pcDNA3.1, LEPRE1/pcDNA3.1, Negative Control siRNA, or siLEPRE1) A549 cells. Equal numbers of cells were cultured in 96-well plates for 72 h. After the indicated time points, proliferation rates were analyzed using WST-1 proliferation assays. Error bars represent the SEM from three independent experimental replicates. (b) Comparison of cell morphology in transfected A549 cells (pcDNA3.1, LEPRE11/pcDNA3.1, Negative Control siRNA, or siLEPRE1). Scale bar, 800 μm. (c,d) Migration (c) and invasion (d) abilities of transfected A549 cells were evaluated using Transwell or Matrigel-coated Transwell plates, respectively. After 24 h, the migrated or invading cells were fixed, stained with crystal violet, and photographed. Representative images of Transwell inserts demonstrating stained migrating or invading cells are shown (left side). The relative migration or invasive abilities of the indicated cells are displayed in the bottom panel. Values shown are means ± SEMs from three independent experiments. Scale bar, 200 μm; n.s. not significant; *p < 0.05; ***p < 0.001. (e) Colony formation assays of transfected A549 cells treated with DMSO or the indicated concentration of pelitinib for 7 days. Representative images of colonies are shown (left side). The ability of transfected A549 cells to form colonies was normalized to the control cells, which are shown in the middle negative control column. Responsiveness to pelitinib treatments was normalized to each corresponding DMSO control (right side). Scale bar, 200 μm. Data are presented as the mean ± SEM of three independent experiments. n.s. not significant; *p < 0.05; **p < 0.01.

