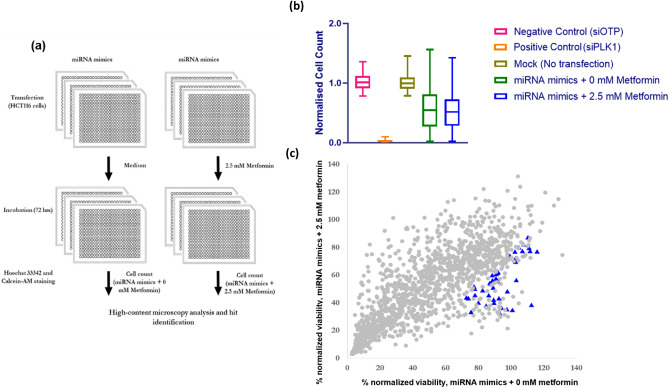
Figure 1.
Schematic of high throughput screen of miRNA mimics, summary of data for CRC cell response to metformin treatment and scatter plot representation of the metformin sensitization screen with a miRNA mimic library. (a) Workflow of functional miRNA mimic screen is demonstrated. HCT116 cells were reverse transfected with 25 nM miRNA mimics and following 24 h incubation, cells were treated with 2.5 mM metformin or control medium for 72 h. Endpoint high-content image analysis was performed for cells stained with Hoechst 33342 and Calcein-AM. (b) Summary of viability data for the functional high throughput screen of miRNA mimics in combination with metformin is shown. Negative control for cell death is represented by the viability of cells transfected with negative control (OTP) and positive control is represented by the cells transfected with siRNA targeting PLK1. Mock control also shows the control for transfection (c) Percent viability of HCT116 cells reverse transfected with miRNA mimics and treated with 2.5 mM (y- axis) or 0 mM metformin (x-axis) are shown. The viability values were normalized against siOTP values and miRNAs selected for a secondary screen (blue triangles).

