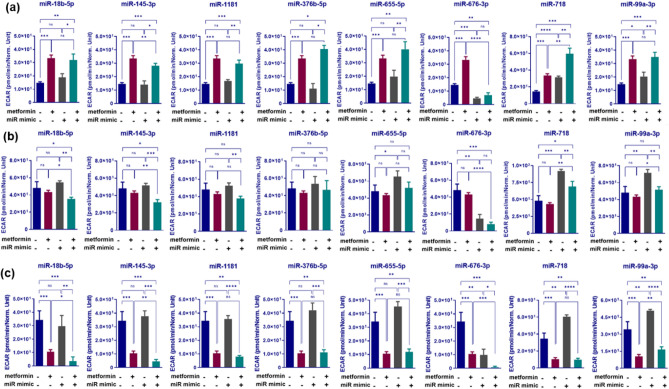
Figure 3.
Changes in glycolysis (a), maximum glycolytic capacity (b) and glycolytic reserve (c) associated with miRNA mimic transfections in combination with metformin treatment of HCT116 cells. CRC cells were reverse transfected with selected miRNA mimics and treated with 2.5 mM metformin or control medium. Extracellular acidification rate (ECAR) of the cells was determined over a 30-min period using a Seahorse XFe-96 Instrument. The ECAR values were normalized to viability of the cells per group determined by crystal violet assay. Results are expressed as mean ± SD of 3 culture replicates and the statistical significance is indicated with asterisks (ns P > 0.05, *P ≤ 0.05, **P ≤ 0.01, ***P ≤ 0.001, ****P ≤ 0.0001.

