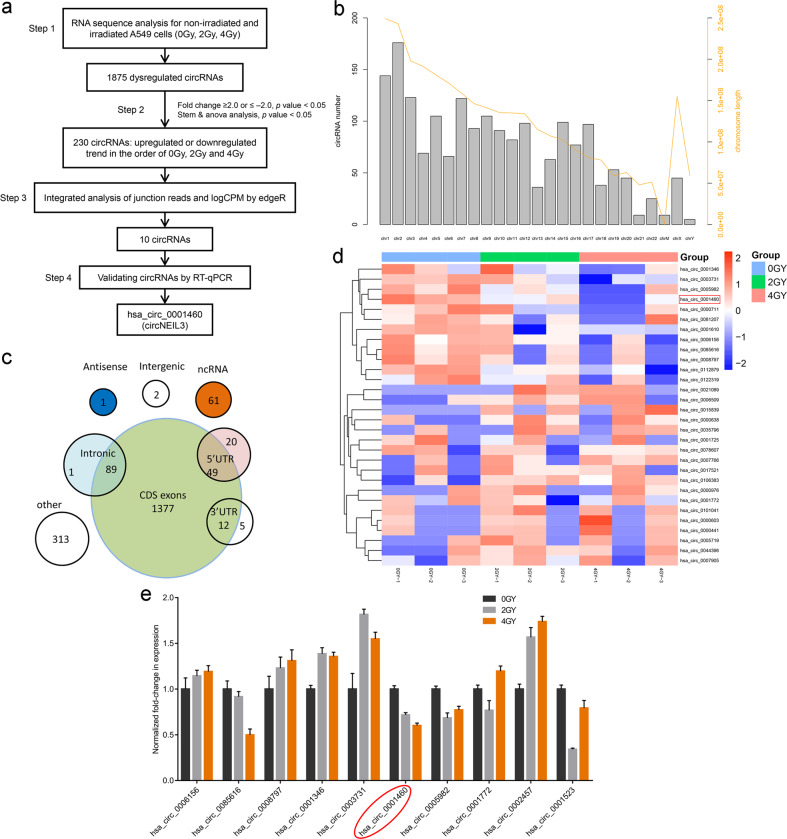
Fig. 1. The circRNA expression profile workflow in the irradiated LUAD cells.
a Flow chart for identifying and validating circRNAs in A549 cells. b Distribution map of circRNAs based on chromosome location. c Distribution map of circRNAs based on category. d Heatmap showing the top 15 most upregulated and top 15 most downregulated circRNAs in A549 cells treated with either 0, 2, or 4 Gy radiation, respectively. e Ten most representative circRNAs verified using RT-qPCR.

