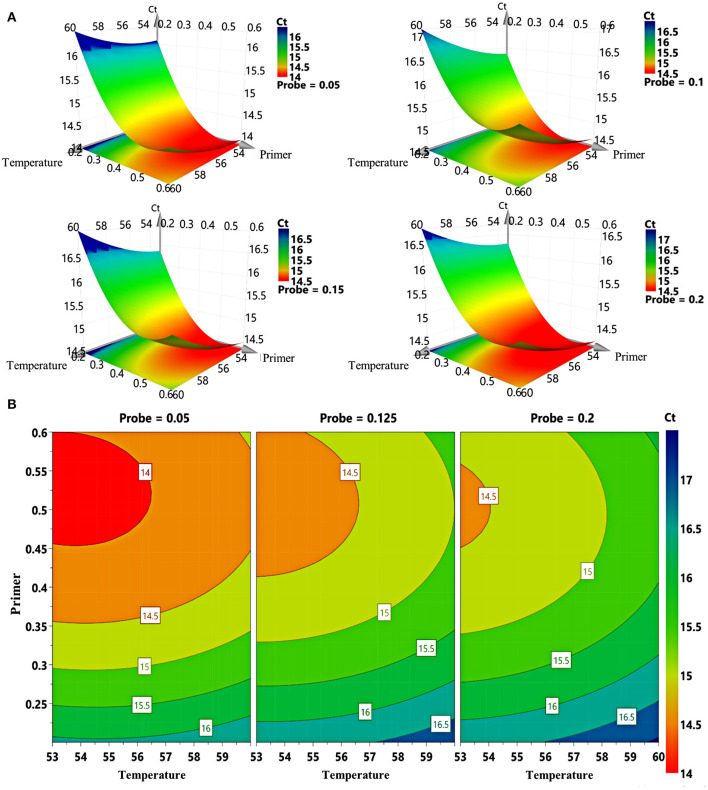
Figure 1.
Response surface plots for FCV. (A) 3D response graphs based on different combinations of primer concentration, probe concentration, and annealing temperature generated by computer-aided exchange procedure. (B) Response surface graphs of primer concentration and annealing temperature at different probe concentrations.

