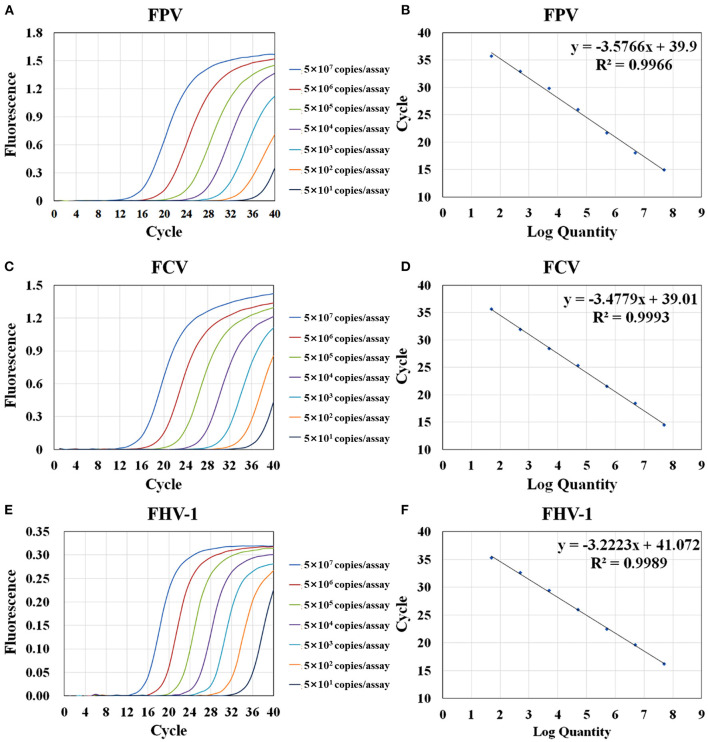
Figure 4.
Amplification and standard curves of the triplex assay. Serially diluted plasmids were mixed at equal concentration (from 5 × 10⁷ copies/assay to 5 × 101 copies/assay) and used as template for RT-PCR. Amplification curves of the triplex assay for the detection of FPV (A), FCV (C), and FHV-1 (E). The standard curves of FPV (B), FCV (D), and FHV-1 (F) were generated by plotting the Ct values (Y-axis) against the logarithm of copy numbers of plasmids (X-axis).

