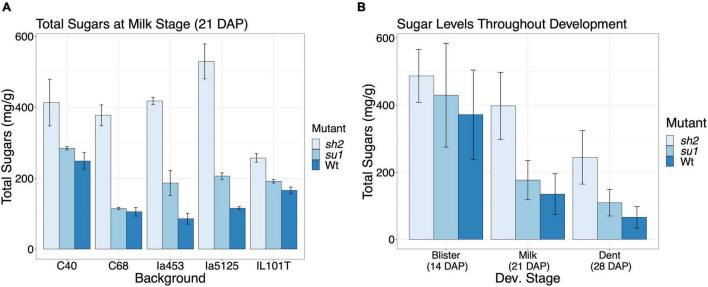
FIGURE 1.
Sugar levels across NILs. (A) Comparison of sugar levels in different NILs at milk stage (21 DAP). Values represent the mean sum of sucrose, glucose, and fructose in percent of the dry tissue weight ± SE. (B) Comparison of sugar level in different mutants at different developmental stages. Values represent the mean sum of sucrose, glucose, and fructose across genotypes in percent of the dry tissue weight ± SE.

