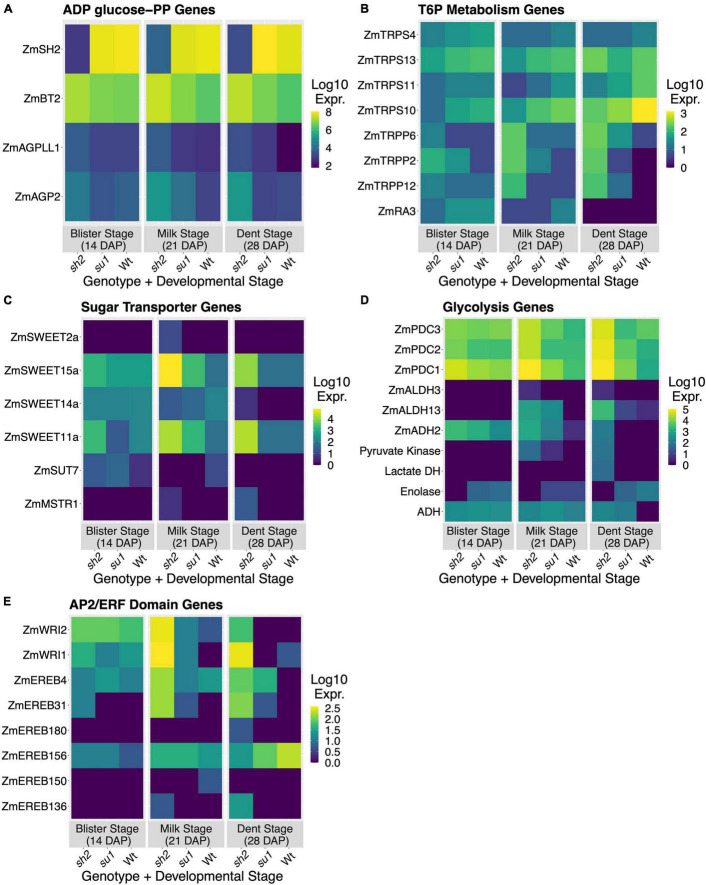
FIGURE 4.
Differential expression in maize endosperm. Relative expression levels of DEGs in each mutant/timepoint combination. Values shown represent the log10 of the TPM summed across transcripts and averaged across backgrounds. (A) Relative expression of AGPase-encoding genes. (B) Relative expression of trehalose-6-phosphate metabolizing enzymes. (C) Relative expression of sugar-transporting genes. (D) Relative expression of genes encoding glycolytic enzymes. (E) Relative expression of AP2/ERF domain transcription factors.

