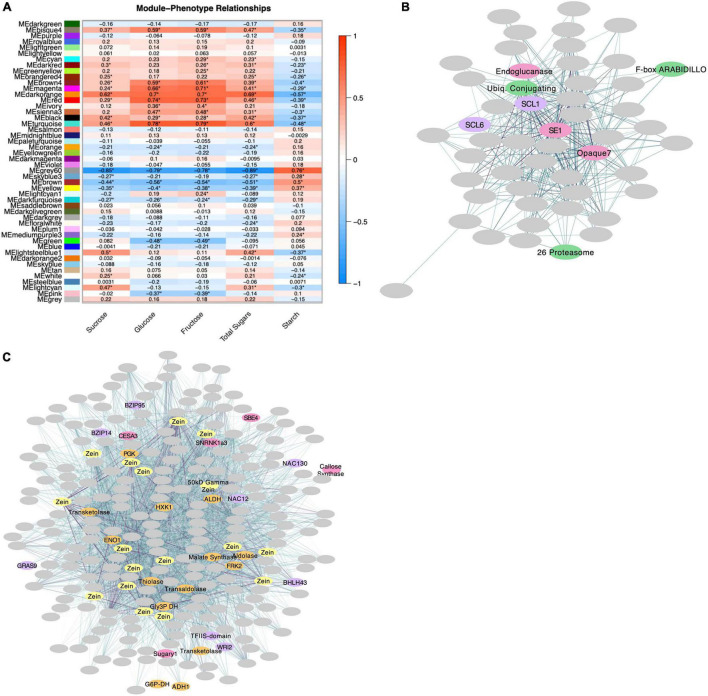
FIGURE 5.
WGCNA results. (A) Pairwise correlations between module eigengenes and phenotypic values. Significance (P-value < 0.05) is indicated with an asterisk. (B) Visual representation of Module Lightsteelblue1 using the yFiles organic layout format. SCF-complex genes are indicated in green, genes that impact grain filling and starch metabolism are indicated in pink, and transcription factors in purple. Connection weight is indicated by line color, where darker lines represent higher-weighted connections. (C) Module Grey60 represented by Cytoscape Network Analyzer using the yFiles organic layout format. Genes encoding zein proteins are indicated in yellow, genes involved in carbohydrate metabolism are indicated in pink, transcription factors in purple and glycolytic genes in orange. Connection weight is indicated by line color, where darker lines represent higher-weighted connections.

