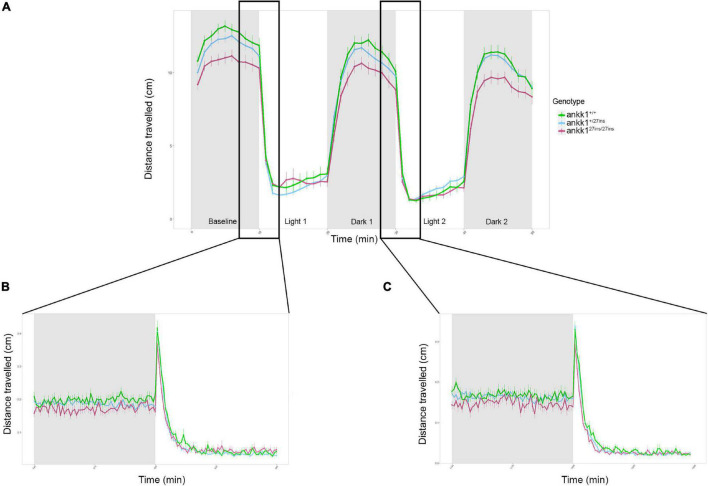
FIGURE 7.
Forced light/dark test in 5 days post fertilization zebrafish larvae (ankk1+/+, ankk1+/27ins, ankk127ins/27ins). (A) The assay consisted of 10 s of basal tracking, followed by two light/dark cycles of 10 min each. Dots represent mean distance traveled per minute. Error bars show standard error of the mean. (B,C) One-second time bins resolution plots of the dark/light transitions.

