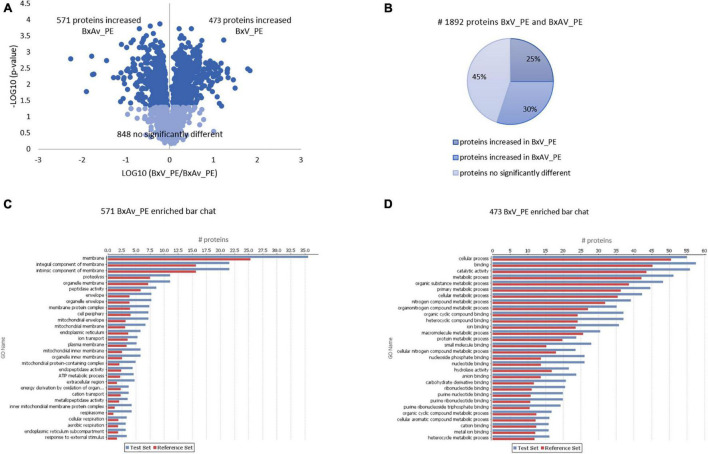
FIGURE 5.
Quantitative analysis of whole nematodes proteins and gene ontology enrichment analysis of differentially expressed proteins in Bursaphelenchus xylophilus isolates under pine extract (PE) stimulus. Volcano plot (A) and pie chart (B) reflecting the results from the statistical analysis of the proteomes of B. xylophilus virulent isolate (BxV_PE) and avirulent isolate (BxAv_PE) with statistical analysis of the 1,892 proteins quantified and differentially expressed (p < 0.05), considering all conditions, performed by the Kruskal–Wallis test followed by the Dunn’s test for multiple comparisons. An enriched bar chart reflecting GO enrichment analysis of the 571 proteins increased in BxAv_PE (C) and 473 proteins increased in BxV_PE (D) against all the 2,741 quantified proteins in the proteomes using the statistical Fisher’s Exact Test (p < 0.05).

