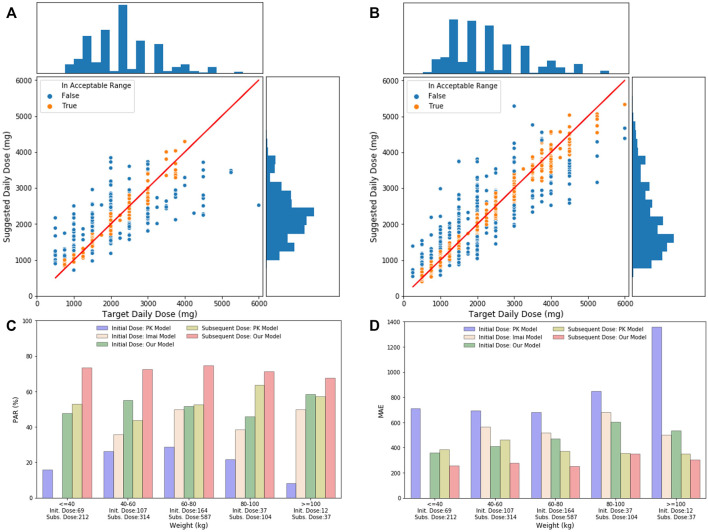
FIGURE 5.
(A) Initial daily dose suggested by our models and the target daily dose in the test set. The solid line indicates perfect match where the suggested daily dose equals to the target daily dose. The bar chart on the top is the distribution of target daily dose, and the bar chart on the right shows the distribution of suggested daily dose. (B) Subsequent daily dose suggested by our models and the target daily dose in the test set. (C) Comparison of PAR of different models, including the PK initial dose model, Imai model, our initial model, PK subsequent model, and our subsequent model, stratified by patient’s weight groups in test data. Number of records in each weight group is shown under the x-axis. (D) Comparison of MAE of different models, including the PK initial dose model, Imai model, our initial model, PK subsequent model, and our subsequent model, stratified by patient’s weight groups in test data.

