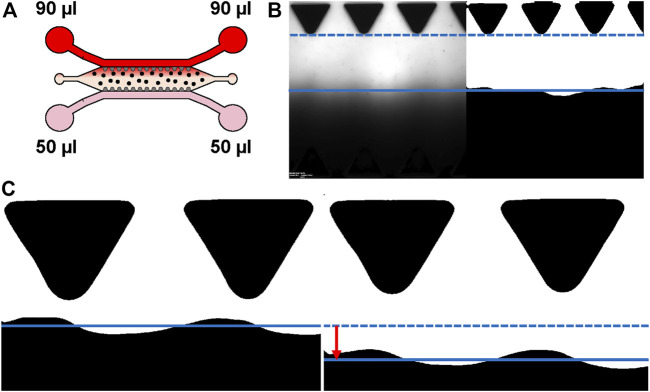
FIGURE 1.
Characterizing interstitial flow within the used microfluidic chip. (A) Schematic representation of the experimental set-up for flow measurements. Gravity-driven flow [(90 µl + 90 µl)+(50 µl + 50 µl)] across the hydrogel area was generated by applying 50 µl of 1xDPBS to the medium reservoirs (pink) and 90 µl of 70 kDa Rhodamine B isothiocyanate–Dextran in 1xDPBS for the opposing medium reservoirs (red). Spatial change of the fluorescent wave front was imaged sequentially. Cells are depicted as dots. (B) Example of original and binarized image used for estimating maximal flow rate. (C) Example of the tracked waveforms of two consecutive images. Solid and dashed lines demonstrate the averaged waveform locations presenting the difference (red arrow) between averaged waveform locations between these two image indexes. The average change is then used to estimate current flow rate. Donor cell lines BMSC 1 and ASC 3 were used for the flow characterization co-cultures.

