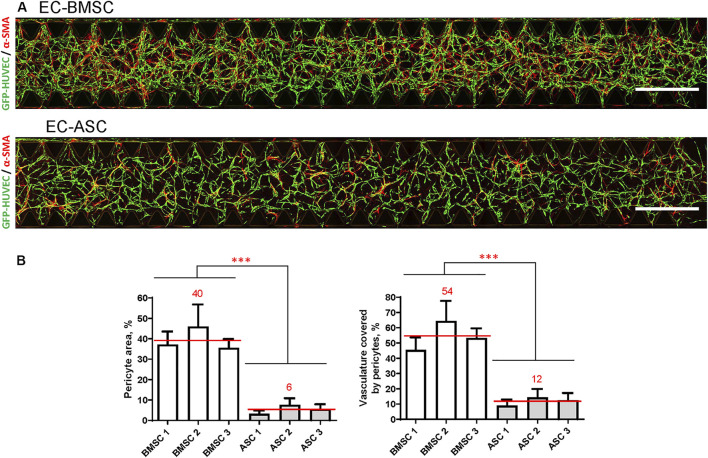
FIGURE 6.
BMSCs have greater pericytic capacity when co-cultured with ECs in a microfluidic chip compared to ASCs based on significantly higher pericyte area and pericytes coverage. (A) Whole chip scans showing alignment of perivascular MSCs (red, marked by α-SMA staining) with vasculature (green) in EC-BMSC and EC-ASC co-cultures at day 6. Images are maximum intensity projections of confocal stacks 200 µm height. Scale bars, 1 mm. (B) Quantifications of pericyte area and pericyte coverage (vasculature covered by pericytes) are shown individually for BMSCs and ASCs derived from different donors. Data are presented as means of 15 ROIs (3 devices, five ROIs per device); error bars, SD; *** denotes p < 0.001 with Unpaired student’s t-test. Comparison between BMSCs and ASCs was performed on mean values from EC-BMSC and EC-ASC co-cultures (3 donors, 3 devices per donor, 5 ROIs per device). Donor cell lines BMSC 1 and ASC 2 were used for generation of data presented in (A).

