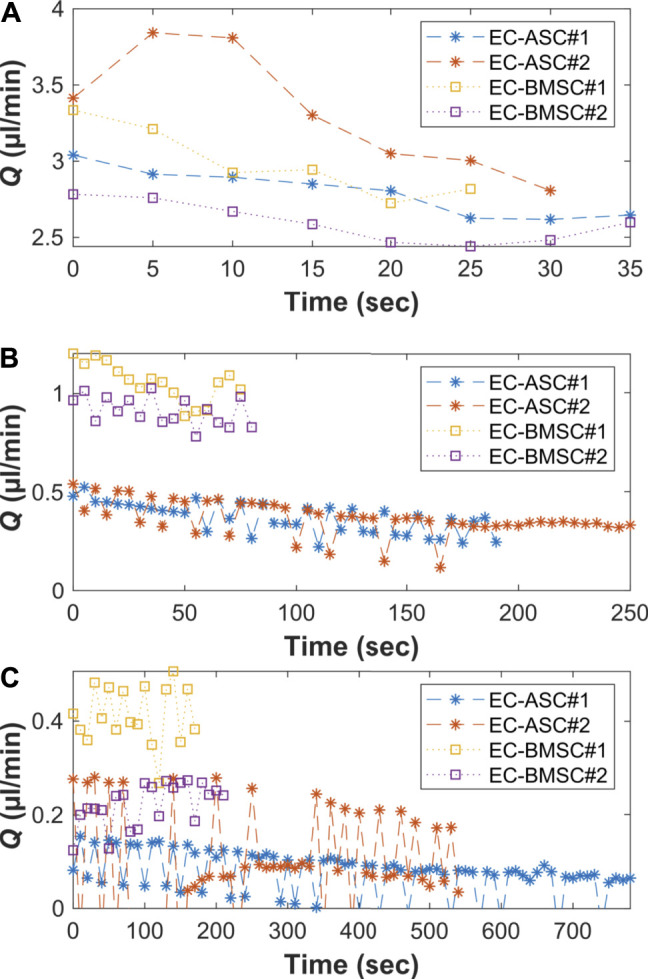
FIGURE 7.

Measured average flow rates (Q) [(90 µl + 90 µl)+(50 µl + 50 µl)] on two independent biological replicates (N = 2) on (A) day 0, (B) day 2, and (C) day 4 for both EC-ASC (*) and EC-BMSC (□) co-cultures. (C) At day 4, there is minimal flow front movement between two consecutive image indexes due to decreased flow rate. This results in reduced accuracy of the used analysis method that is seen as oscillation of the measured flow rate values. Donor cell lines BMSC 1 and ASC 3 were used for the flow characterization co-cultures.
