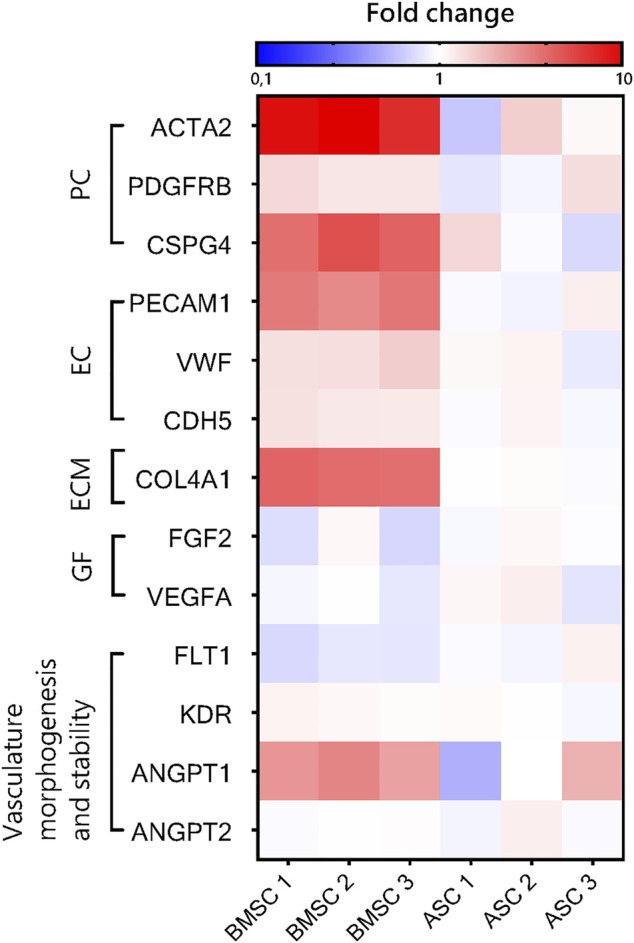
FIGURE 9.

Quantitative RT-PCR analysis of gene expression in ASC- and BMSC-supported microvascular networks. Heatmap shows relative mRNA expression of pericyte-specific (PC) and endothelial-specific (EC) genes, ECM protein (ECM), angiogenic growth factors (GF), and other genes involved in vasculature morphogenesis and stability in EC-ASC and EC-BMSC co-cultures after 6 days of culture. Gene expression fold change of EC-BMSC and EC-ASC cocultures was computed relative to the average expression in EC-ASC co-cultures. The reference genes were 18S and GAPDH (for PECAM1, VEGFA, PDGFRB, CSPG2, ACTA2, ANGPT1, FGF2) and PECAM1 (for VWF, CDH5, KDR, FLT1, ANGPT2).
