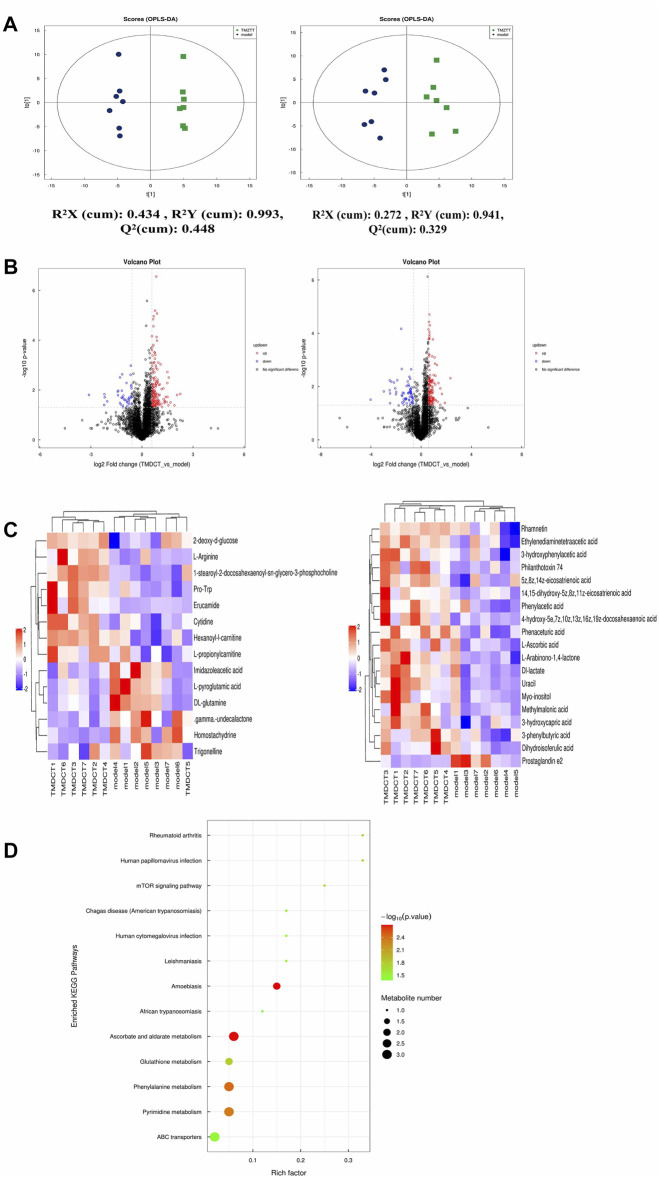
FIGURE 3.
Untarget plasma metabolism detection. (A) OPLS-DA analysis of LC/MS data in positive mode (left) and negative mode (right) from TMDCT(H) vs. Model. (B) Volcano map of differential metabolites in positive and negative mode. The metabolites with FC > 1.5, p value <0.05 are indicated by rose red, satisfying FC < 0.67, p value < 0.05 are shown in blue. (C) Hierarchical clustering heat map in positive mode (left) and negative mode (right). (D) Enriched KEGG pathways based on significant different metabolites between TMDCT(H) group and Model group. n =7 animals per group.

