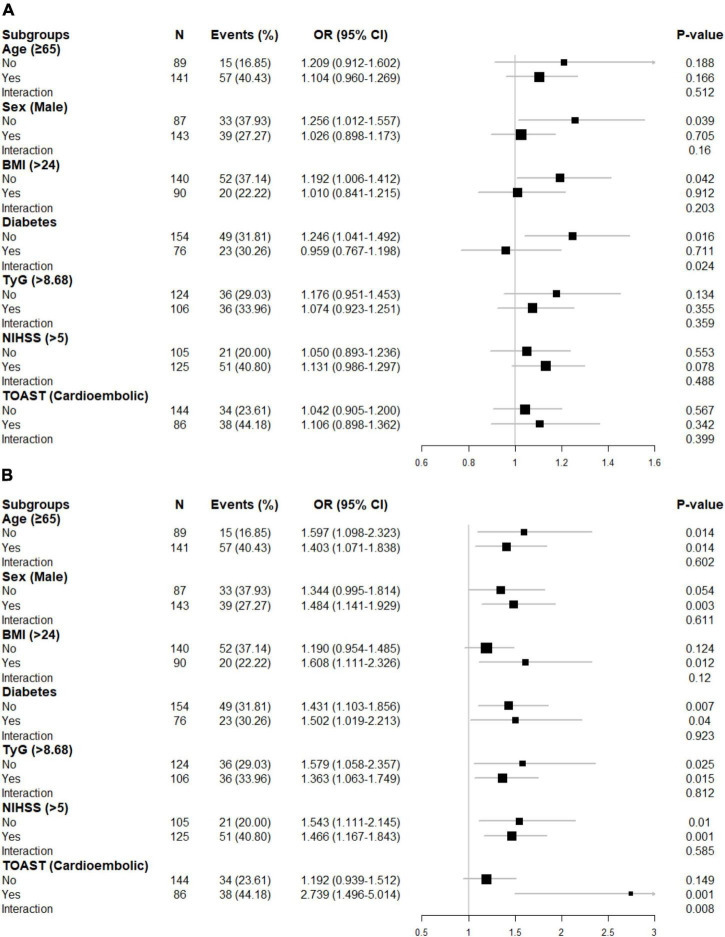
FIGURE 3.
Subgroup analyses for the risk of poor functional outcome by (A) SHR1 defined as [admission RBG (mmol/L)]/[HbA1c (%)], (B) SHR2 defined as [FBG (mmol/L)]/[HbA1c (%)]. The above model adjusted for age, sex, current smoking, hyperlipidemia, atrial fibrillation, prior stroke, systolic blood pressure (SBP), and NIHSS at admission. In each case, the model is not adjusted for the stratification variable. BMI, body mass index; TyG, triglyceride-glucose index; NIHSS, National Institutes of Health Stroke Scale score; TOAST, Trial of Org 10172 in Acute Stroke Treatment.

