
Figure 3.
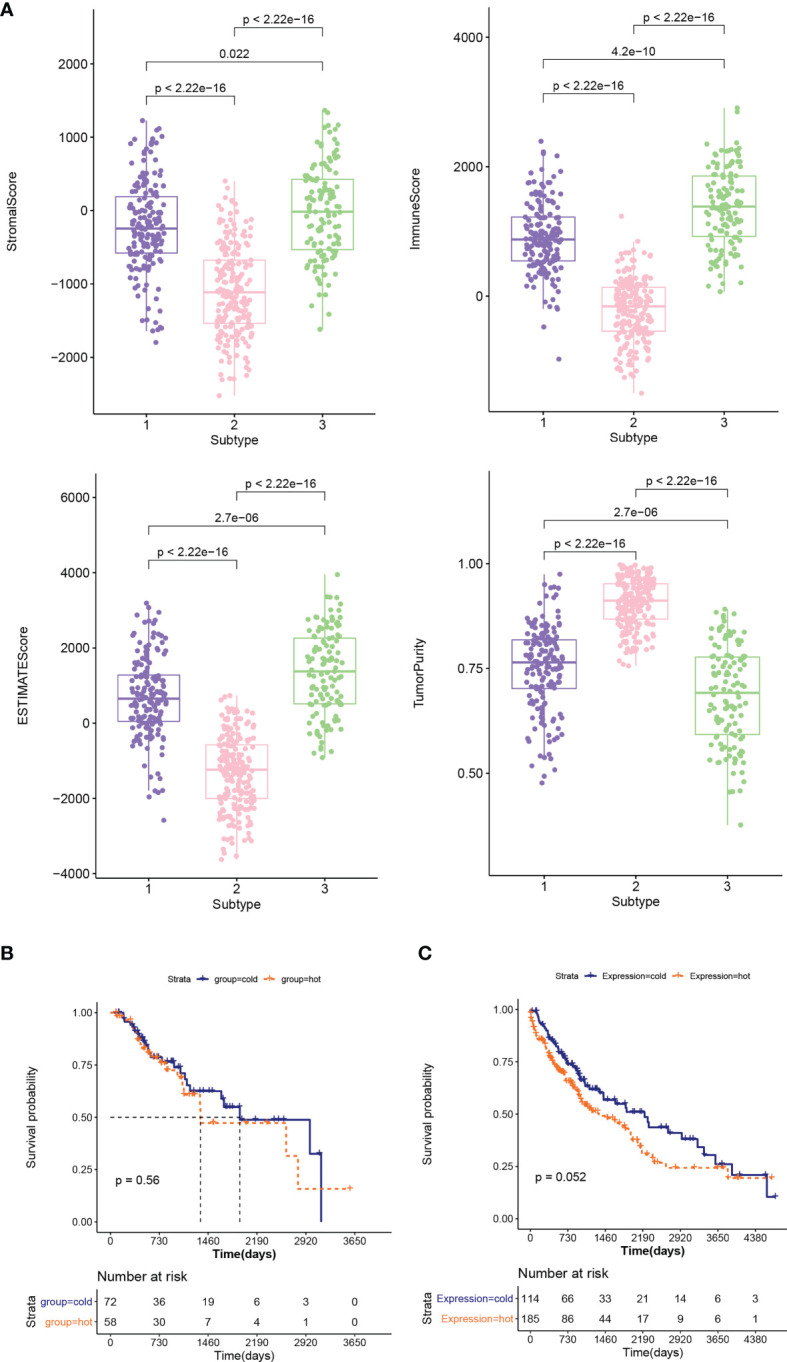
(A) Comparison of the distribution of stroma score, ESTIMATE score, immune score, and tumor purity in different subtypes. (B, C) KM curves associated with survival outcomes between cold and hot tumor groups in chemotherapy (B) and non-treatment groups (C).