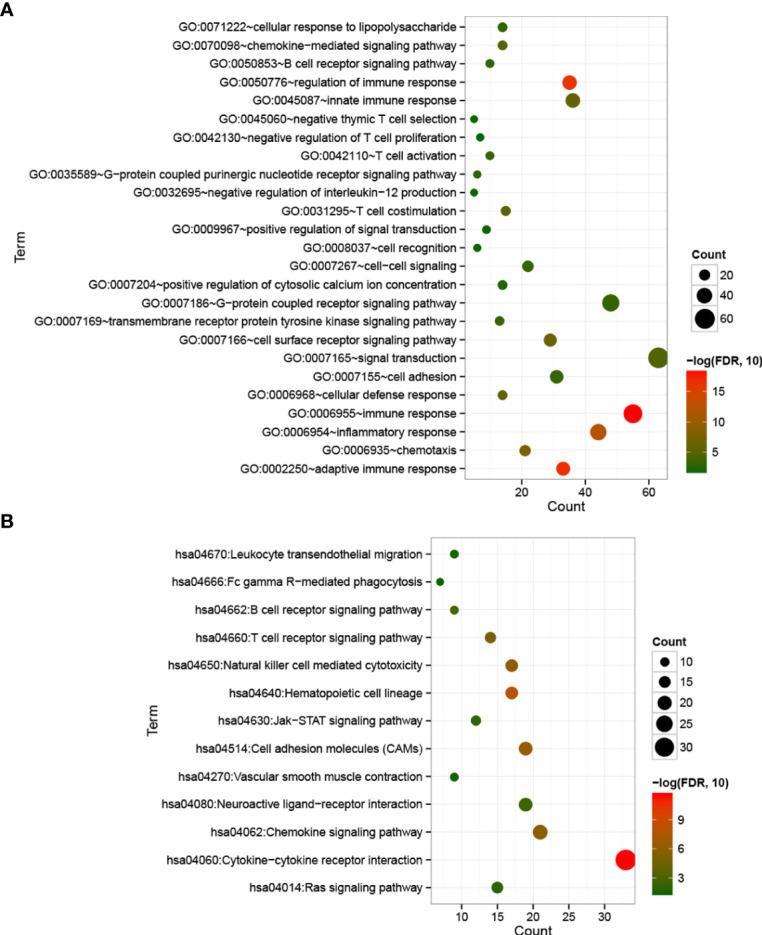
Figure 5.

Bubble maps of biological processes (A) and KEGG signaling pathways (B) associated with significantly differentially expressed genes. The horizontal axis represents the number of differentially expressed genes, the vertical axis represents the name of the item, and the size of the dot represents the number of DEGs.
