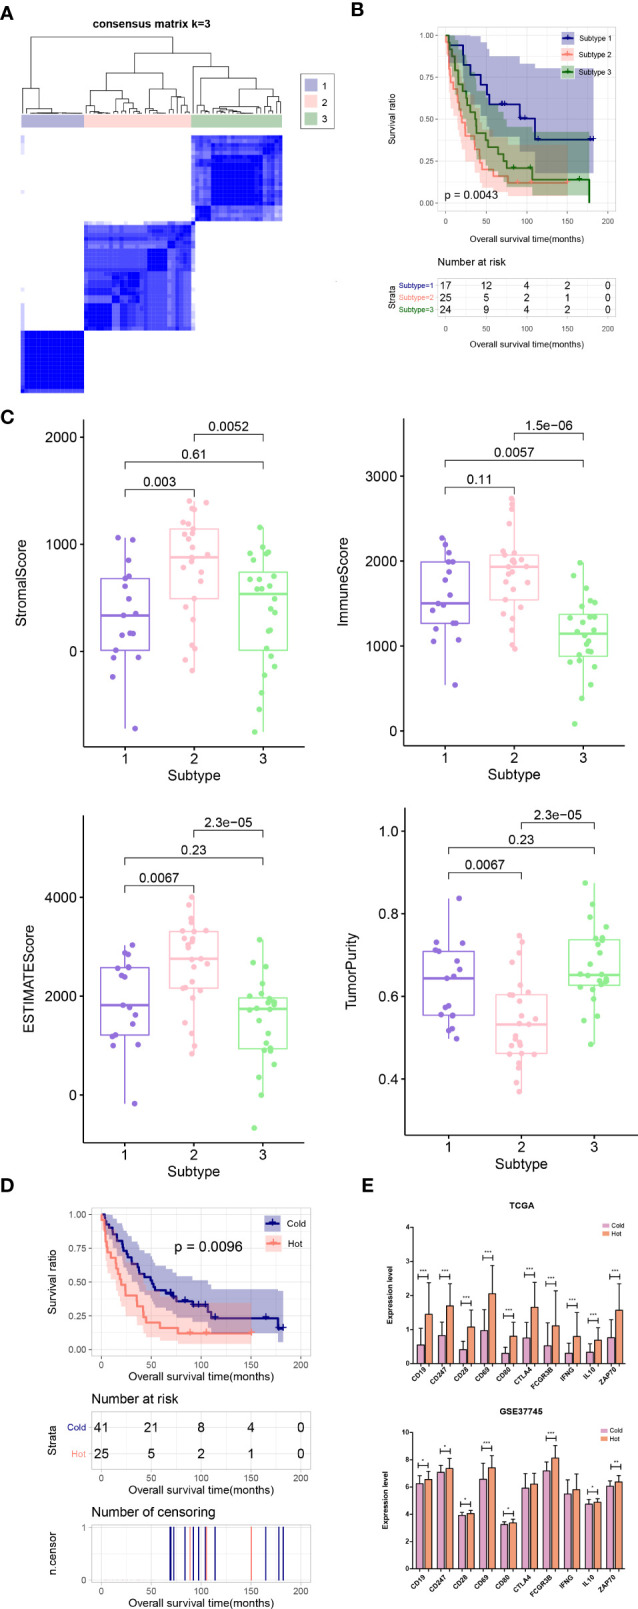
Figure 8.

(A) Sample subtype analysis cluster diagram in the validation set. (B) KM survival curves of different subtypes in validation set. (C) Comparison of the distribution of stroma score, ESTIMATE score, immune score, and tumor purity in different subtypes in validation set. (D) KM curves associated with survival outcomes in the Hot and Cold sample groups in validation set. (E) Expression level distribution of top10 hub genes in Cold and Hot tumor samples in the TCGA training set and validation dataset GSE37745. *P < 0.05; **P < 0.01; ***P < 0.001.
