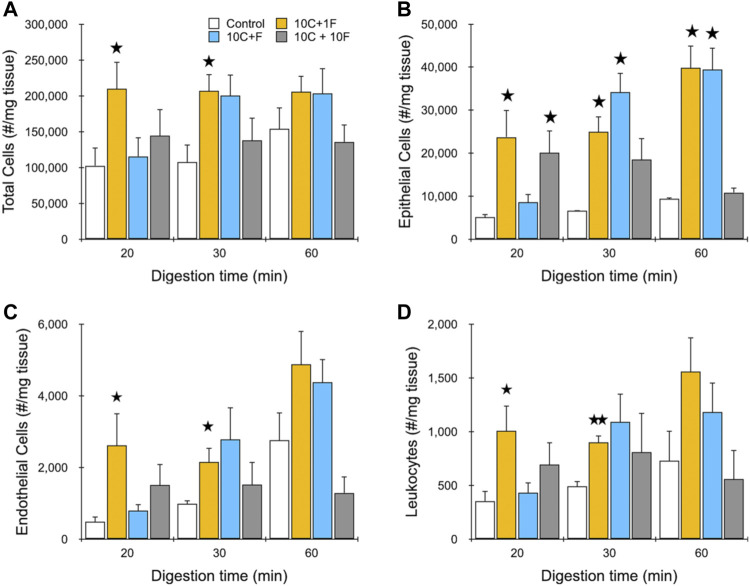
FIGURE 4.
Evaluation of dissociation formats using murine kidney. Kidneys were harvested, minced, and digested for the indicated time periods. Samples were then passed through the channel module 10 times and filter module once (10C, 1F), simultaneously through both modules 10 times (10C + F), or sequentially through both modules 10 times (10C + 10F) at 40 ml/min and the resulting cell suspensions were analyzed using flow cytometry. Controls were pipetted/vortexed and passed through a cell strainer. Results are shown for viable and single (A) total cells, (B) EpCAM + epithelial cells, (C) endothelial cells, and (D) leukocytes. Optimal results were attained using the single filter pass at each digestion time. Data are presented as mean values ± SEM from at least three independent experiments. Two-sided t test was used for statistical testing. Stars indicate p < .05 and double stars indicate p < .01 relative to the control at the same digestion time.

