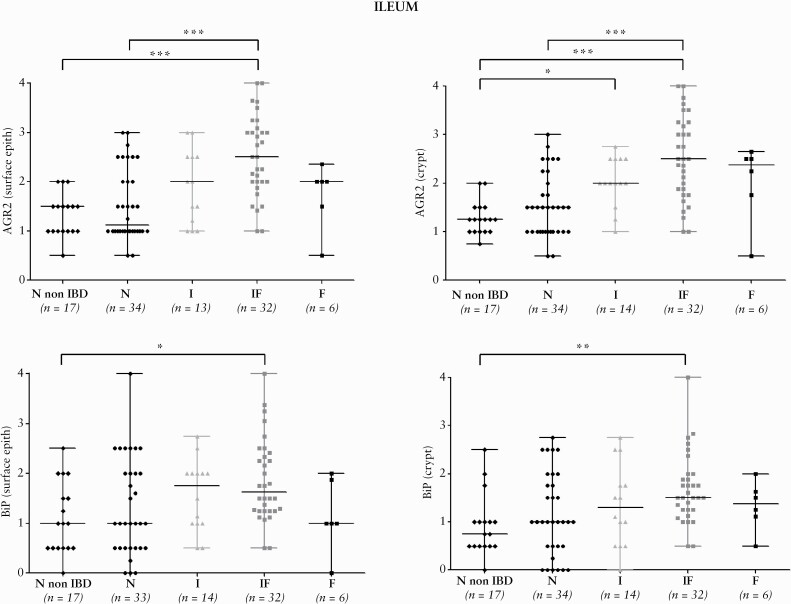
Figure 3.
Distribution of AGR2 and BiP IHC scores for ileal tissues. Distribution of AGR2 and BiP IHC scores for the CD patients groups [N, I, IF, F] and non-IBD controls in the surface and crypt epithelium for ileal tissues. In some samples, due to ulceration associated with the fibrotic area, only the crypt epithelium could be scored. The ANOVA test was significant for AGR2 and BiP in the surface epithelium [p <0.0001 and p <0.05, respectively] and in the crypt epithelium [p < .0001 and p <0.001, respectively]. Horizontal black lines highlight the significant two-by-two comparisons of groups obtained by Dunn’s multiple comparison test. *p <0.05, **p <0.001, ***p <0.0001. IHC,immunohistochemical; CD, Crohn’s disease.

