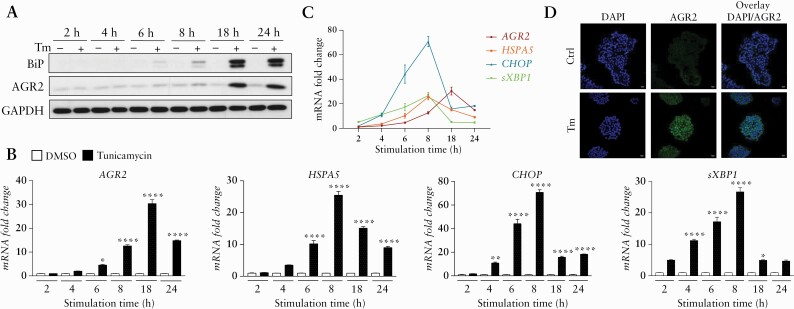
Figure 4.
ER stress markers increase after Tm induction on HT-29. [A] Western blot [WB] analysis of AGR2 and BiP in HT-29 according to tunicamycin [Tm] [10 µg/mL] stimulation time course. The GAPDH was used as loading control. [B,C] RT-qPCR expression fold change of AGR2, HSPA5, CHOP, and sXBP1 in HT-29 under Tm treatment time course [black] compared with time control conditions with DMSO [white]. [D] IF analysis of AGR2 in HT-29 after 18 h of Tm treatment at 10 µg/mL and time control DMSO. *p <0.05, **p <0.01, ***p <0.001, ****p <0.0001. ER, endoplasmic reticulum; IF, IL-3F1-3.

