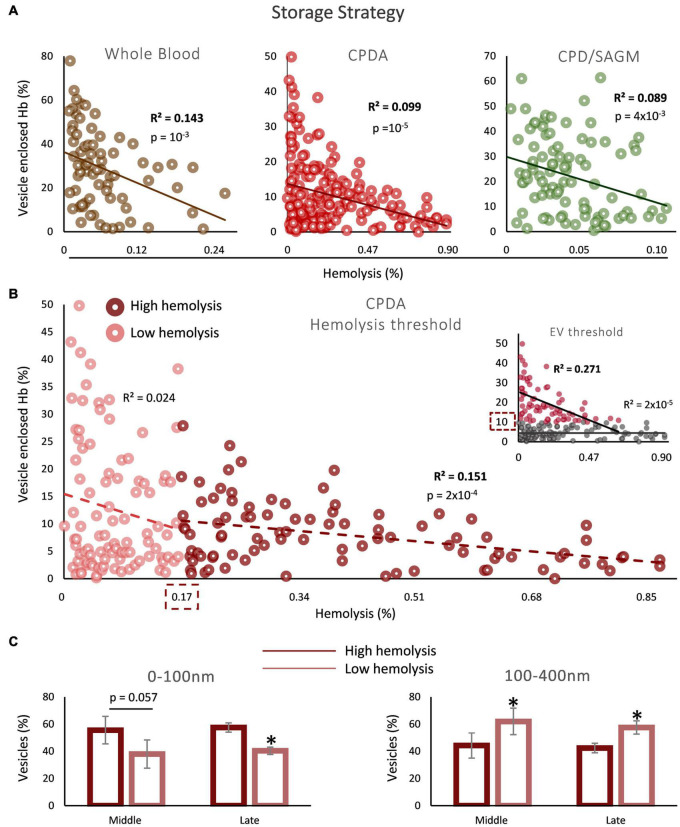
FIGURE 2.
Correlation between vesicle-enclosed Hb and storage hemolysis in blood bank conditions. (A) Scatter plots showing the correlation between total free and vesicle-enclosed Hb in whole blood, CPDA and CPD-SAGM units, from mid-storage onward. (B) Threshold analysis in CPDA blood units. The dashed boxes indicate the hemolysis or EV-Hb percentage (insert) values that serve as cutoffs. (C) Dynamic light scattering (DLS) analysis in selected CPDA samples of high and low hemolysis (above and below the threshold, respectively; n = 5 per group) during middle and late storage (horizontal axis). *p < 0.05, high vs low storage hemolysis.

