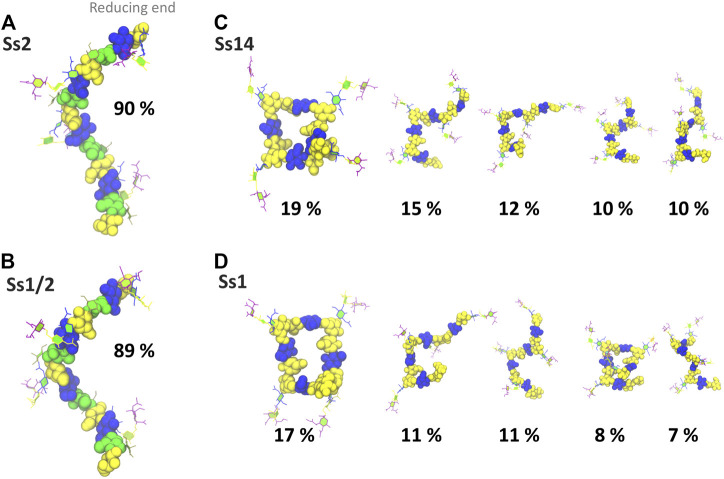
FIGURE 3.
Main conformational families and associated percentages of the CPS molecules shown with the side chains in the PaperChain visualisation and the CPS backbone in a space-filling representation. Representative conformations for RU 2–5 (excluding the first and last RU) are shown for (A) Ss2; (B) Ss1/2; (C) Ss14; and (D) Ss1. Conformations are scaled according to their relative percentage occupancies, and clusters less than 6% are not shown. The residues in all representations are coloured in keeping with the SNFG, as follows: βdGal and βdGalNAc—yellow; αdGal—brown; βdGlc—blue; βlRha—green; αdNeu5Ac—purple.

