FIGURE 2.
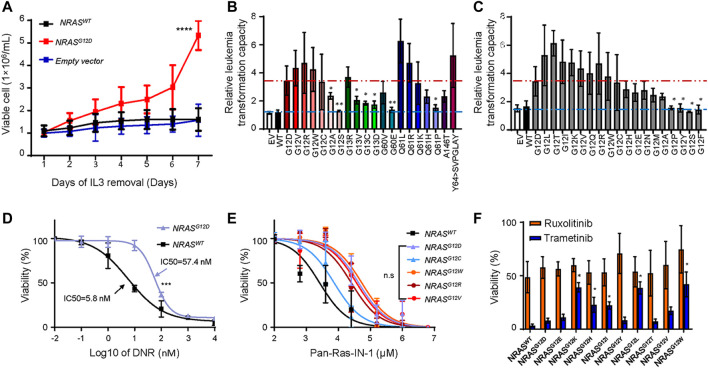
Transforming potentials and drug response of NRAS mutation s in Ba/F3 cell line. (A) IL-3 independent cell growth of Ba/F3 cells transduced with NRAS G12D , NRAS WT and empty vector. (B–C) Relative leukemogenic capacity between reported NRAS mutations (B) and G12 saturated mutant forms (C). Differences were calculated between NRAS G12D and other NRAS mutants by student t test. Dark red dash line represents the NRAS G12D transforming capacity as positive control, and light blue dash line represents non-transforming capacity. The relative capacity was calculated by the ratio of viable cells between day7 and day1. Cytotoxicity of DNR (D), Pan-Ras-IN-1 (E), trametinib and ruxolotinib (F) were examined in Ba/F3 cells with NRAS mutations (black line, NRAS WT ; purple line, NRAS G12D ; blue line, NRAS G12C ; orange line, NRAS G12w ; brown line, NRAS G12R ; red line, NRAS G12V ). The cell viability was measured after 72 h of drug exposure using an CCK-8 assay. All these experiments were performed in triplicate and independently repeated three times. Two-way ANOVA method was used to perform the statistical analysis for (D,E), and student t test was applied for (F)”. p < 0.05 (*, <0.05; **, <0.01; ****, <0.0001) was considered statistically significant.

