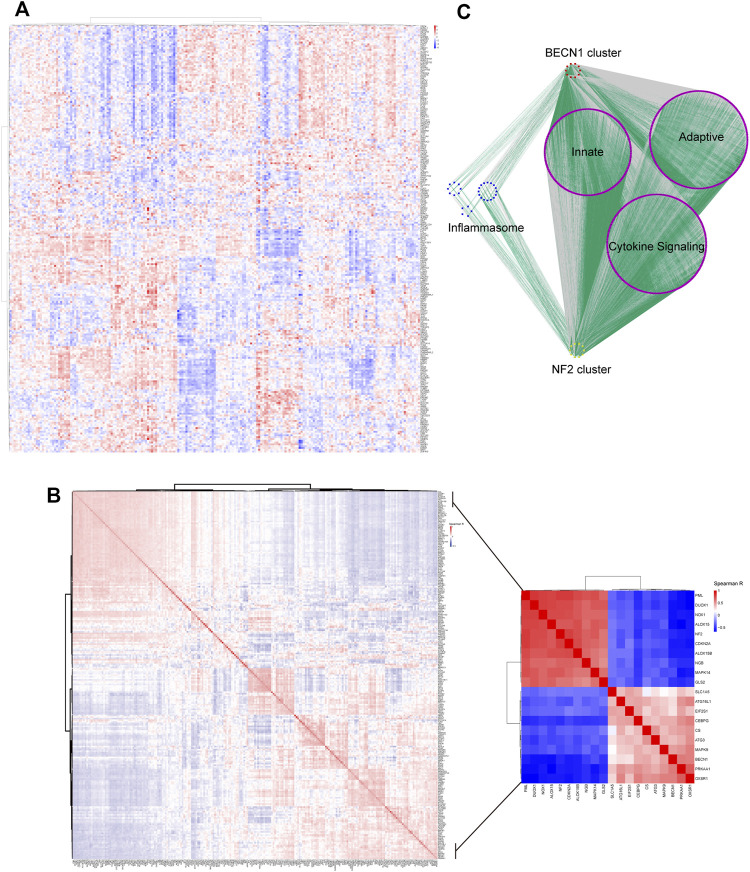
FIGURE 4.
Two major clusters were identified in heterogeneously expressed FRGs. (A) Heatmap showing heterogeneously expressed FRGs across IRI samples. The color bar showed the expression level of genes. (B) Spearman correlation analysis revealed two major clusters with genes in one cluster opposite to the other cluster. The inset displayed the top 10 correlated genes in each cluster. The color bar showed the range of spearman correlation r. (C) Co-expression analysis of the top 10 correlated genes in each cluster with genes involved in inflammasome and immune pathways. Gray lines indicated negative correlation while green lines indicated positive correlation between genes.

