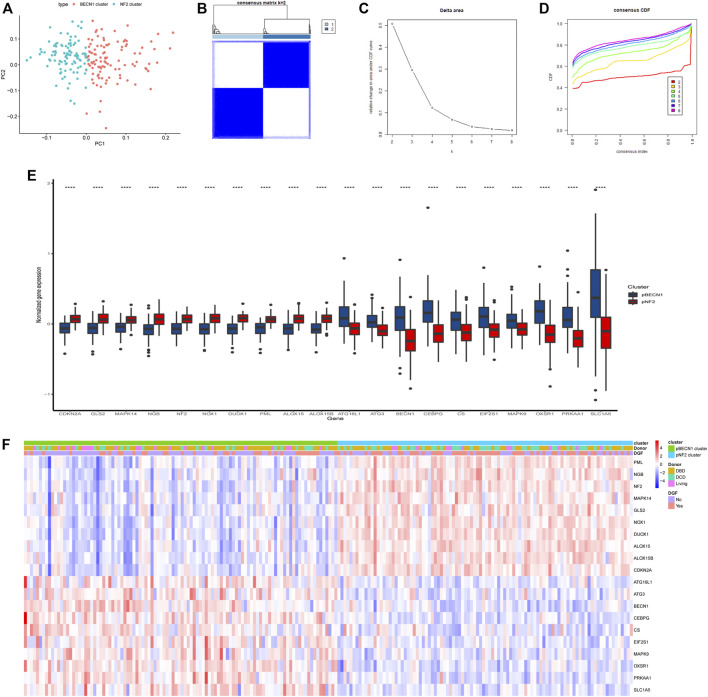
FIGURE 5.
Consensus clustering analysis stratified patients into two clusters based on the top 10 correlated genes in the BECN1 gene cluster and the NF2 gene cluster. (A) Principal component analysis (PCA) showing distinct expression patterns of these two gene clusters. (B) Consensus matrix of IRI samples when k = 2. (C,D) Consensus CDF and relative change in the area under CDF curve when k = 2–8. (E) Gene expression level of top correlated genes in pBECN1 and pNF2 clusters. ****, p < 0.0001. (F) Heatmap showing association of the pBECN1 cluster and the pNF2 cluster with donor types and occurrence of DGF. The expression of the top 10 correlated genes in each cluster was shown. The color bar showed the expression level of genes. DBD, donation after brain death; DCD, donation after cardiac death.

