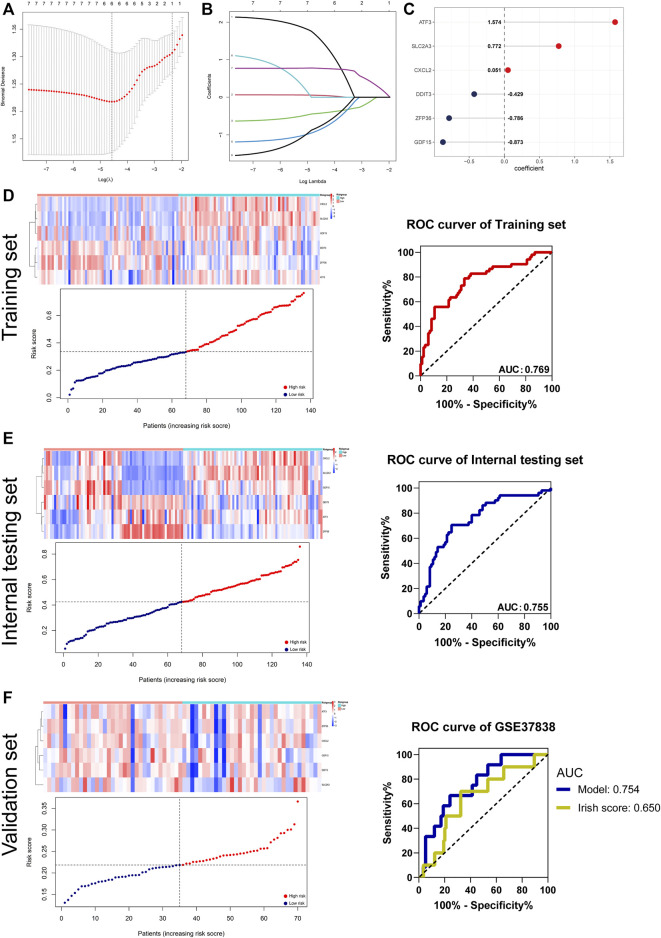
FIGURE 7.
Establishment and validation of the DGF predictive signature. (A,B) DGF predictive signature was established from eight DFRGs. The lambda.min was selected as the best lambda value of the model. (C) LASSO coefficients of candidate genes in the signature. (D–F) Evaluating the performance of the signature in the training set, internal testing set, and validation set (GSE37838). The heatmaps showing gene expression of six genes (CXCL2, SLC2A3, GDF15, DDIT3, ZFP36, and ATF3) in the signature. Patients’ distribution based on the median risk score. ROC curves presenting the efficacy of the signature for predicting DGF in IRI patients. Area under the ROC curve (AUC) was calculated and compared.

