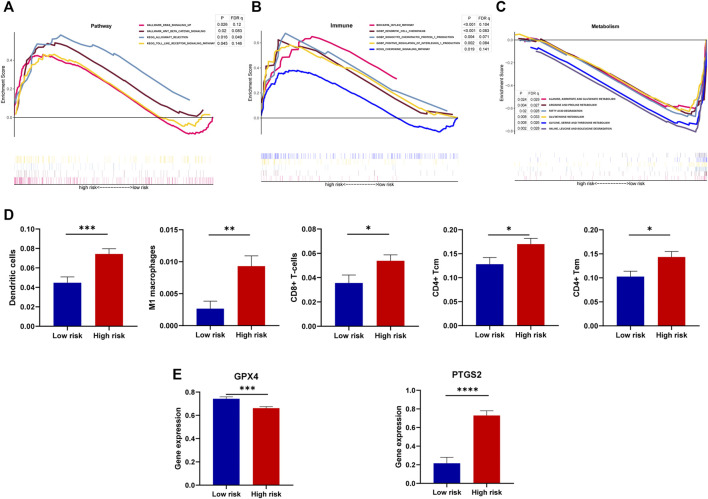
FIGURE 8.
Association of the model with involved function, immune cell infiltration, and ferroptosis. (A–C) GSEA showing the involved function of high-risk and low-risk groups in terms of the DGF-related pathway, immune, and metabolism. Terms with p < 0.05 and FDR q < 0.25 were considered statistically significant. (D) Differences of immune cell infiltration between low-risk and high-risk groups, estimated by the xCell algorithm. (E) Gene expression of key ferroptosis markers, namely, GPX4 and PTGS2 between risk groups. *, p < 0.05; **, p < 0.01; ***, p < 0.001; ****, p < 0.0001.

