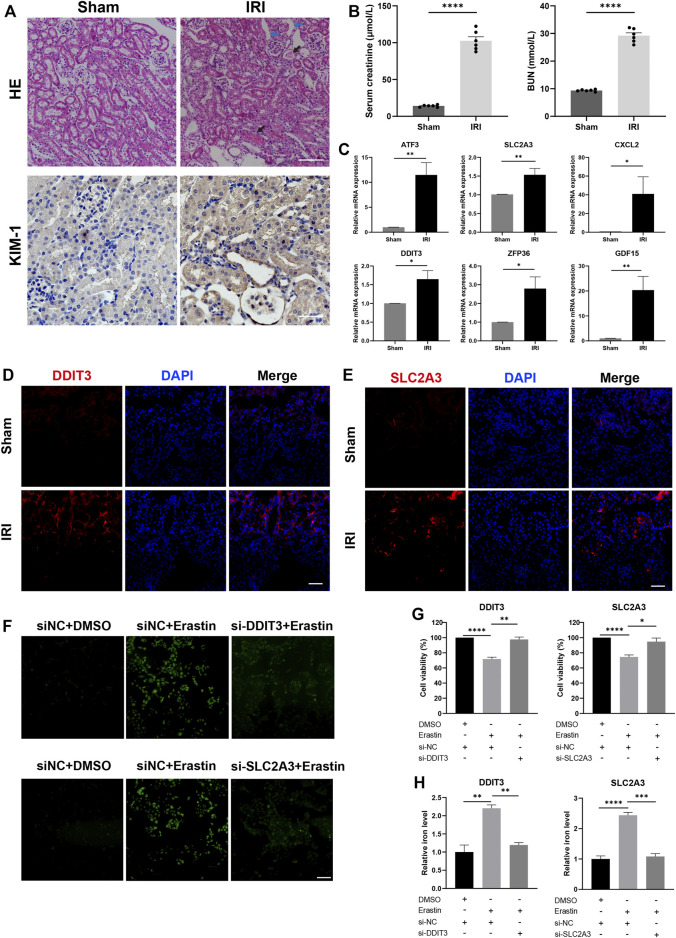
FIGURE 9.
Expression of candidate genes in the renal IRI mouse model and knockdown of DDIT3 and SLC2A3 in HK-2 cell alleviated ferroptosis. (A) Representative images of hematoxylin and eosin staining and immunohistochemistry staining of KIM-1 in IRI mice and sham mice. The image of IRI showed tubular cell death, effacement of brush border (blue arrow), and proteinaceous casts in tubules (black arrow). Scale bars, 100 μm. n = 3 per group. (B) Serum creatinine and BUN were measured in the IRI group and the sham group. n = 6 per group. (C) mRNA expression level of ATF3, SLC2A3, CXCL2, DDIT3, ZFP36, and GDF15 in kidney tissue of the IRI group and the sham group. n = 3 per group. (D,E) Representative immunofluorescence images of DDIT3 and SLC2A3 in kidney tissue of IRI mice and sham mice. Nuclei were stained with DAPI (blue). Scale bars, 100 μm. n = 3 per group. (F) ROS generation was detected using DCFH-DA staining. HK-2 cells were transfected with si-DDIT3, si-SLC2A3, or si-NC and treated with erastin (15 μM, 24 h) or DMSO. Scale bars, 200 μm. (G) Cell viability was measured by CCK-8 assay. n = 3 per group. (H) Relative iron level in HK-2 cell was measured. Data were presented as the mean ± standard error of mean. *p < 0.05, **p < 0.01, ***p < 0.001, ****p < 0.0001. IRI, ischemia-reperfusion injury; BUN, blood urea nitrogen; NC, negative control; CCK-8, Cell Counting Kit-8.

