FIGURE 1.

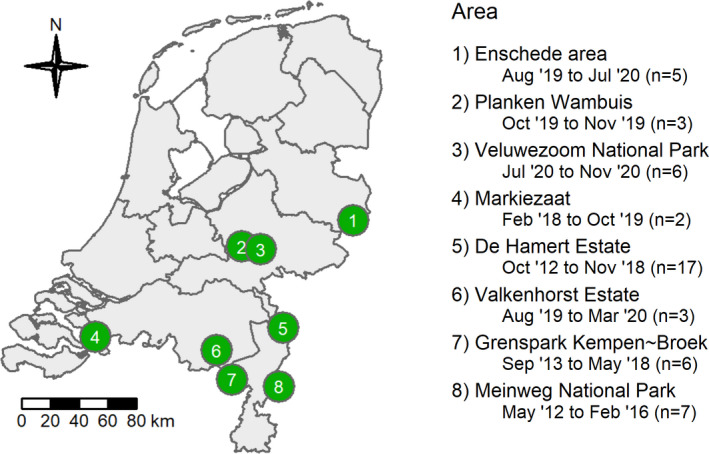
Map of the Netherlands showing the areas where we monitored carcasses until depletion. The period of monitoring and the number of monitored carcasses per area are indicated

Map of the Netherlands showing the areas where we monitored carcasses until depletion. The period of monitoring and the number of monitored carcasses per area are indicated