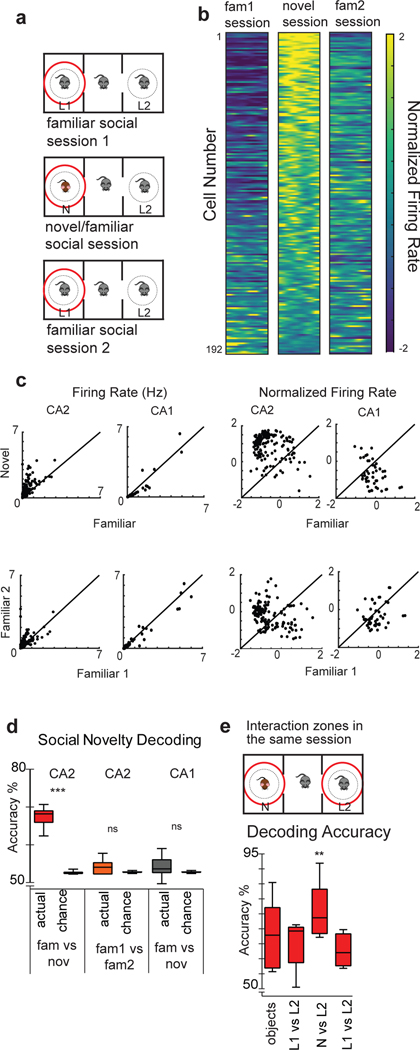
Figure 4. CA2 codes for novel social information.
a, Protocol for measuring CA2 firing rate in all three social sessions when a subject mouse was within the same 7-cm-wide interaction zone around the same cup that contained the novel animal. b, Color-coded Z-scored firing rate in the interaction zone over the time course of the three social sessions for all 192 neurons. Interactions were divided into 50 time bins and firing rate was calculated for each bin to visualize CA2 activity over the course of an interaction (see Extended Data Figure 4 for CA1 data). The population firing rate vector around the novel animal differed significantly from the familiar firing rate vector (p= 0.02, two-sided Wilcoxon rank-sum test). c, Plot of firing rate in the interaction zone around the novel versus familiar mouse (the latter averaged across the two familiar sessions). Each point is a separate cell. None of the CA1 firing rate vectors in the interaction zone are significantly different from one another. Normalized FRs are shown to the left. d, A linear decoder trained on CA2 activity in the interaction zone performed significantly above chance in decoding interactions with a novel (session 4) versus familiar mouse (sessions 3 and 5; p < 0.0001, two-sided Wilcoxon rank-sum test). The CA2-based decoder failed to decode interactions with the same familiar mouse in session 3 (fam1) versus session 5 (fam2). A decoder based on CA1 activity failed to distinguish interactions between the novel and familiar mouse. (n=192 CA2 neurons from 6 animals; n=87 CA1 neurons from 3 animals). e, Performance of a linear decoder trained on CA2 firing in interaction zones around left and right cups in a single session to determine which cup the mouse was around. The two interaction zones could be distinguished in all sessions significantly above chance (p < 0.0001, two-sided Wilcoxon rank-sum test). Decoding accuracy was significantly enhanced in the novel mouse session (session 4) compared to the other three sessions (p =0.004 Wilcoxon rank sum post hoc to Kruskal-Wallis). Box plots display the center line as the mean; box limits are upper and lower quartiles; whiskers show min to max values in data sets. *p<0.05, **p<0.01,***p<0.001, ****p<0.0001.

