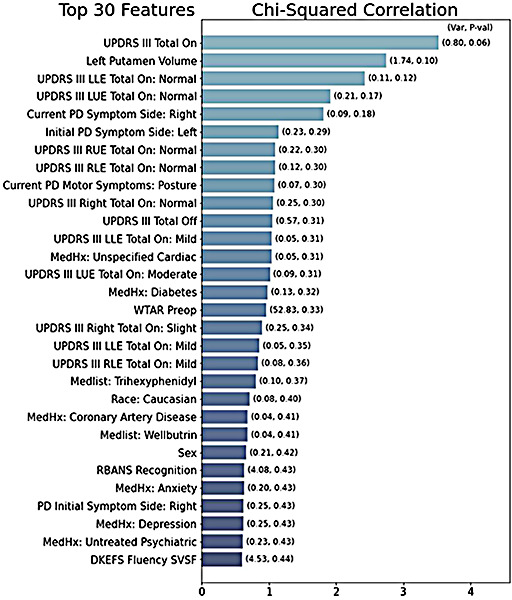
Figure 1:

Bar graph representing the top-30 features, ranked by chi-squared correlation with improved UPDRS III score. The column variance is listed above each column. Features with zero variance are ignored. The white column text shows the calculated p value for the feature.
