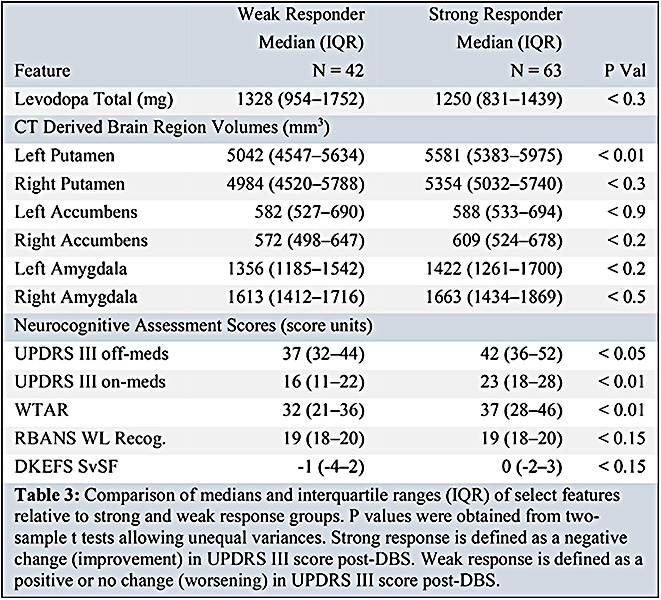
Table 3:
Comparison of medians and interquartile ranges (IQR) of select features relative to strong and weak response groups. P values were obtained from two-sample t tests allowing unequal variances. Strong response is defined as a negative change (improvement) in UPDRS III score post-DBS. Weak response is defined as a positive or no change (worsening) in UPDRS III score post-DBS.

