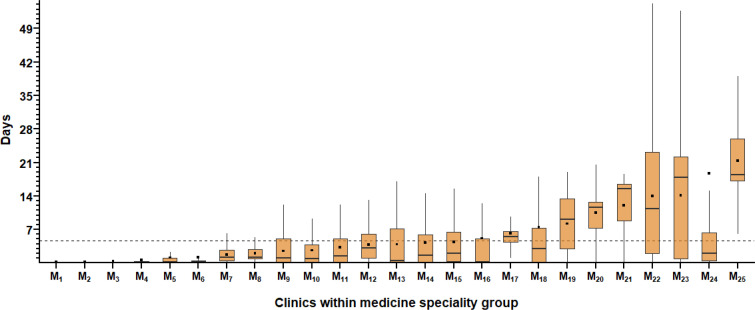
Figure 2.
Days to Complete Chart Notes Within Medicine Specialty Clinics.
Each medicine clinic is represented on the x-axis by their ID (M1-25). The dashed, black line represents the overall sample mean.
Statistical components of the boxplots are explained in the first footnote to Figure 1.

