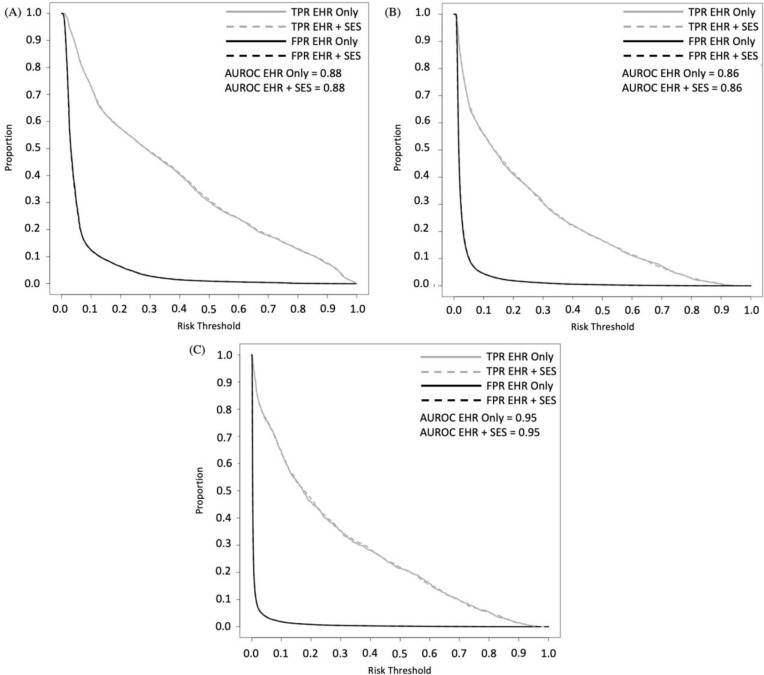
Figure 1a-c.
Classification plots for models with and without census-tract variables for (a) Alcohol-only; (b) Opioid-only, and (c) Alcohol and Opioid misuse.
EHR = electronic health record; SES = socioeconomic status from census-tract variables; FPR = false-positive rate; TPR = true-positive rate; EHR-only = baseline line model; EHR+SES = enhanced model with census tract variables; AUC = area under the receiver operating characteristics

