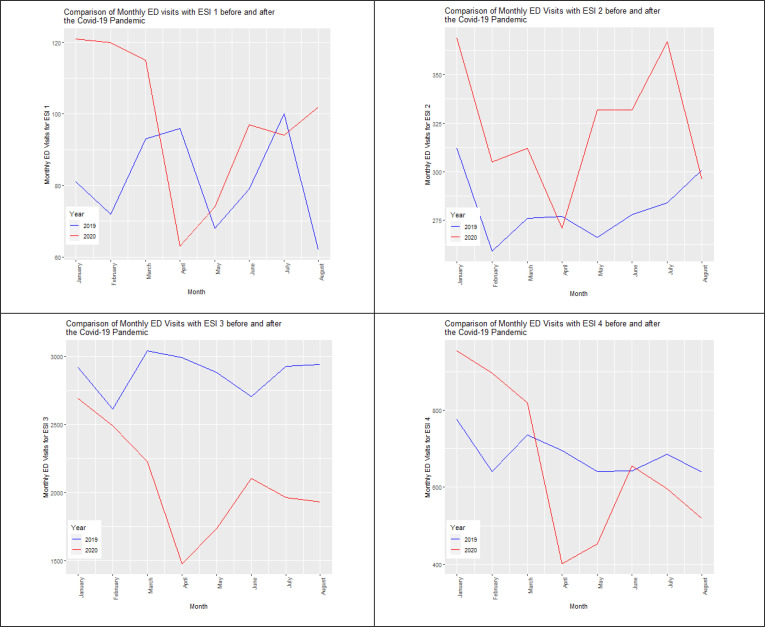
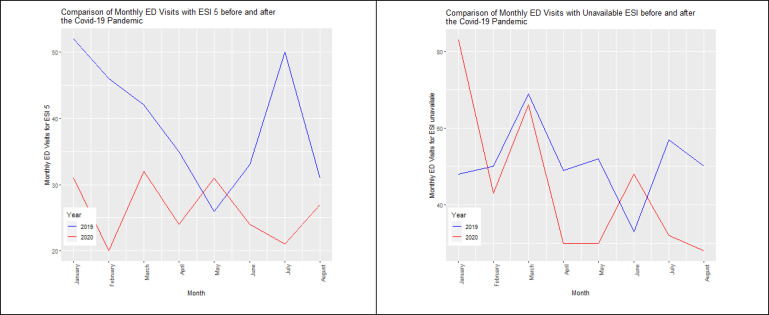
Figure 3.
Trends in the monthly ED visits for each ESI before and during the COVID-19 pandemic. Figure 3 shows that, during the pandemic, the medical center had the lowest number of ED visits for each ESI in April, except for the ED visits with ESI 5.


