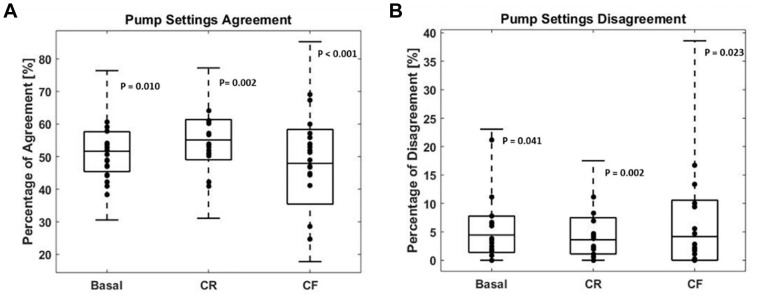
Figure 2.
Level of agreement and disagreement in the direction of insulin dose adjustments for basal, CR, and CF plans.CF, correction factor; CR, carbohydrate-to-insulin ratio.
Level of agreement (A) and disagreement (B) per pump setting. The box plot represents the among-physician comparisons showing the median, interquartile range, minimum, and maximum (N = 136) per pump setting feature. Dots represent the Advisor Pro–physician comparisons (N = 17) per pump setting feature.

