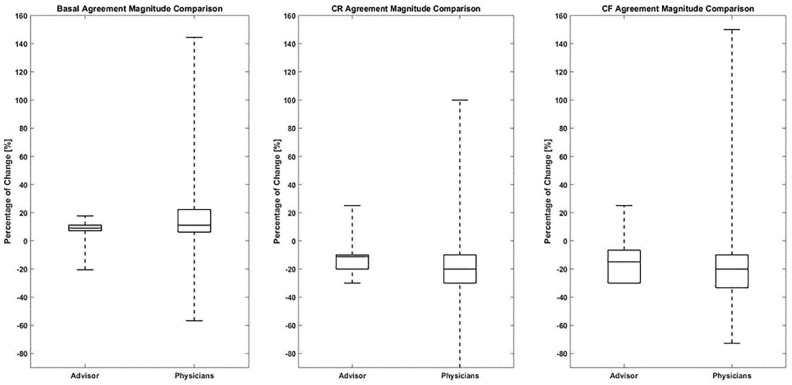
Figure 3.
Magnitude of insulin pump dosing adjustments in cases of full agreement for basal, CR, and CF plans.
CF, correction factor; CR, carbohydrate-to-insulin ratio. Percentage of change in insulin dosing pump parameters: basal, CR, and CF plans in cases of full agreement (increase or decrease) on the direction of insulin dosing adjustment (1157 cases for the basal rate, 996 cases for the CR, and 550 cases for the CF).
The box plot displays the median and interquartile range and the dashed line the minimum and maximum of the percentage of dose change. P values for the three parameters: basal P < .001, CR P < .01 and CF not significant.

