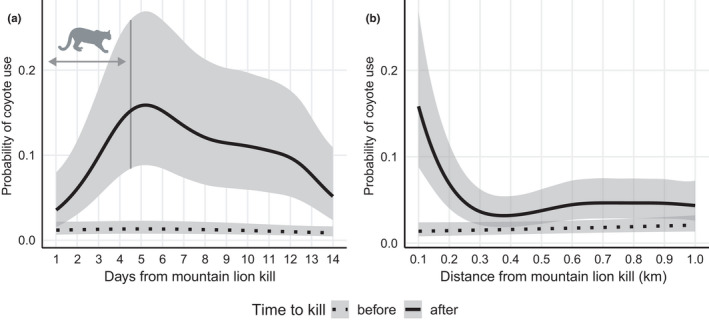
FIGURE 6.

Probability of coyote (Canis latrans) use at predicted kills made by mountain lions (Puma concolor) and shaded 95% CIs for two weeks before (dotted line) and after (solid line) the kill. (a) The probability of use across the 14 days on either side of the kill, where the x‐axis extends across 14 days pre‐kill for the “before” line and 14 days post‐kill for the “after” line. The vertical dark gray line represents the average time spent at kill sites by mountain lions in the time after the kill was made (mean = 4.50 days, 95% CI = 4.35–4.66, IQR = 2.50–5.47). (b) The probability of use assessed within concentric rings surrounding kills with radii ranging from 100–1000 m. Coyote and mountain lion kill site data collected during May 2017–September 2020 in southwestern Wyoming, USA
