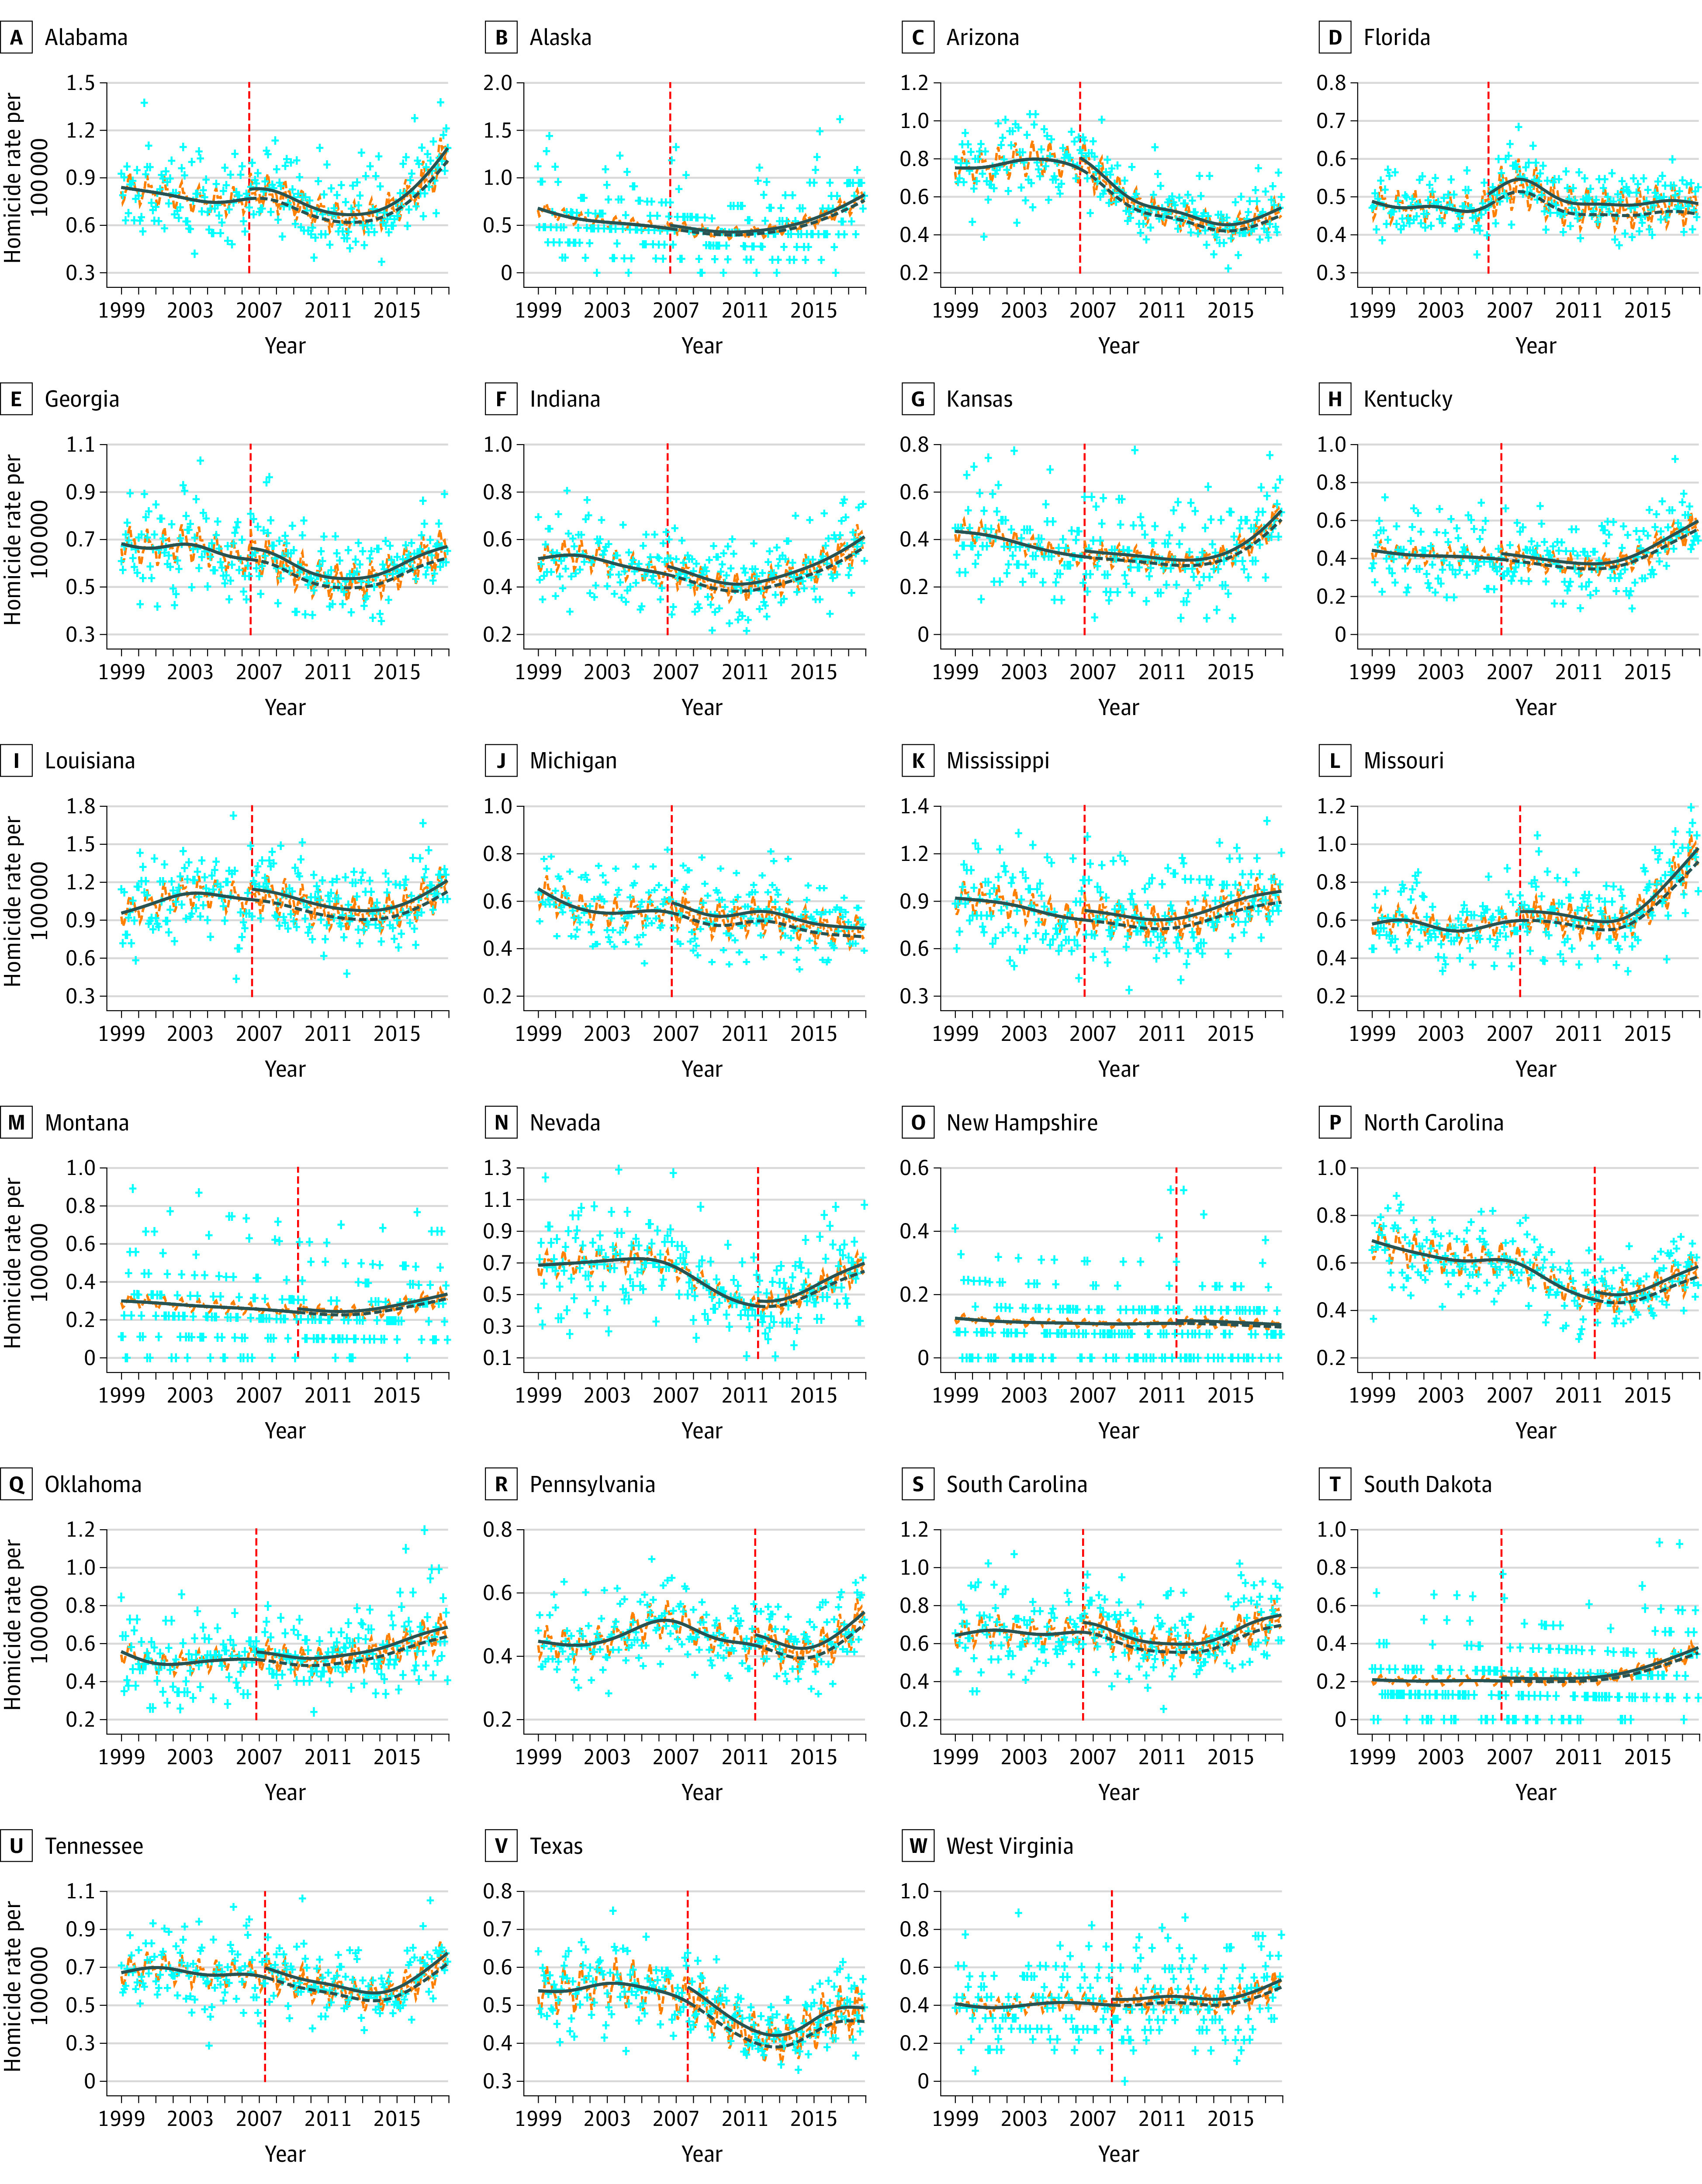
Figure 1. Associations of “Stand Your Ground” Laws With Changes in Monthly Homicide Rates Across the United States.

Crosses indicate monthly homicide rates; blue solid lines, smoothed trends for observed rates; orange dotted lines, smoothed seasonality for observed rates; red dotted lines represent the enactment of SYG laws; and blue dotted lines, the smoothed trend for the counterfactual (ie, the expected trend in the absence of an SYG law).
