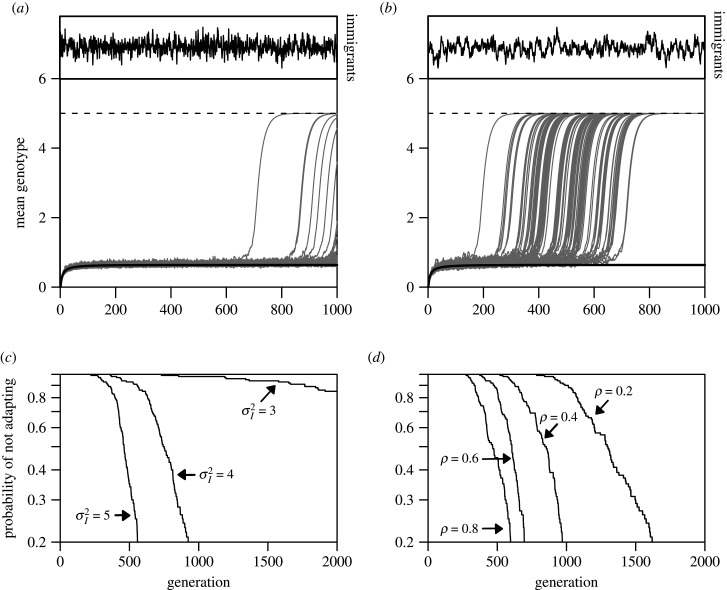
Figure 3.
Effect of temporally varying immigration on adaptation to a sink, colonized at time 0. (a) and (b) illustrate evolutionary trajectories in sinks with temporally varying immigration (). Populations are initially maladapted, with immigrants having mean genotypic values of 0; the solid line shows the maladapted equilibrium, maintained by gene flow hampering selection. The dashed line is the local adapted equilibrium. In a constant environment the population stays maladapted. The ‘probability of not adapting’ by generation t is the fraction of runs still at or near the maladapted equilibrium. Serial autocorrelation of local optima (see the electronic supplementary material, S3 for details and other parameters) is ρ = 0.2 in (a), 0.8 in (b). Insets illustrate how immigration rates vary. (c) Influence of variation in immigration. (d) Effect of autocorrelated immigration (ρ).

