
Figure 3 –
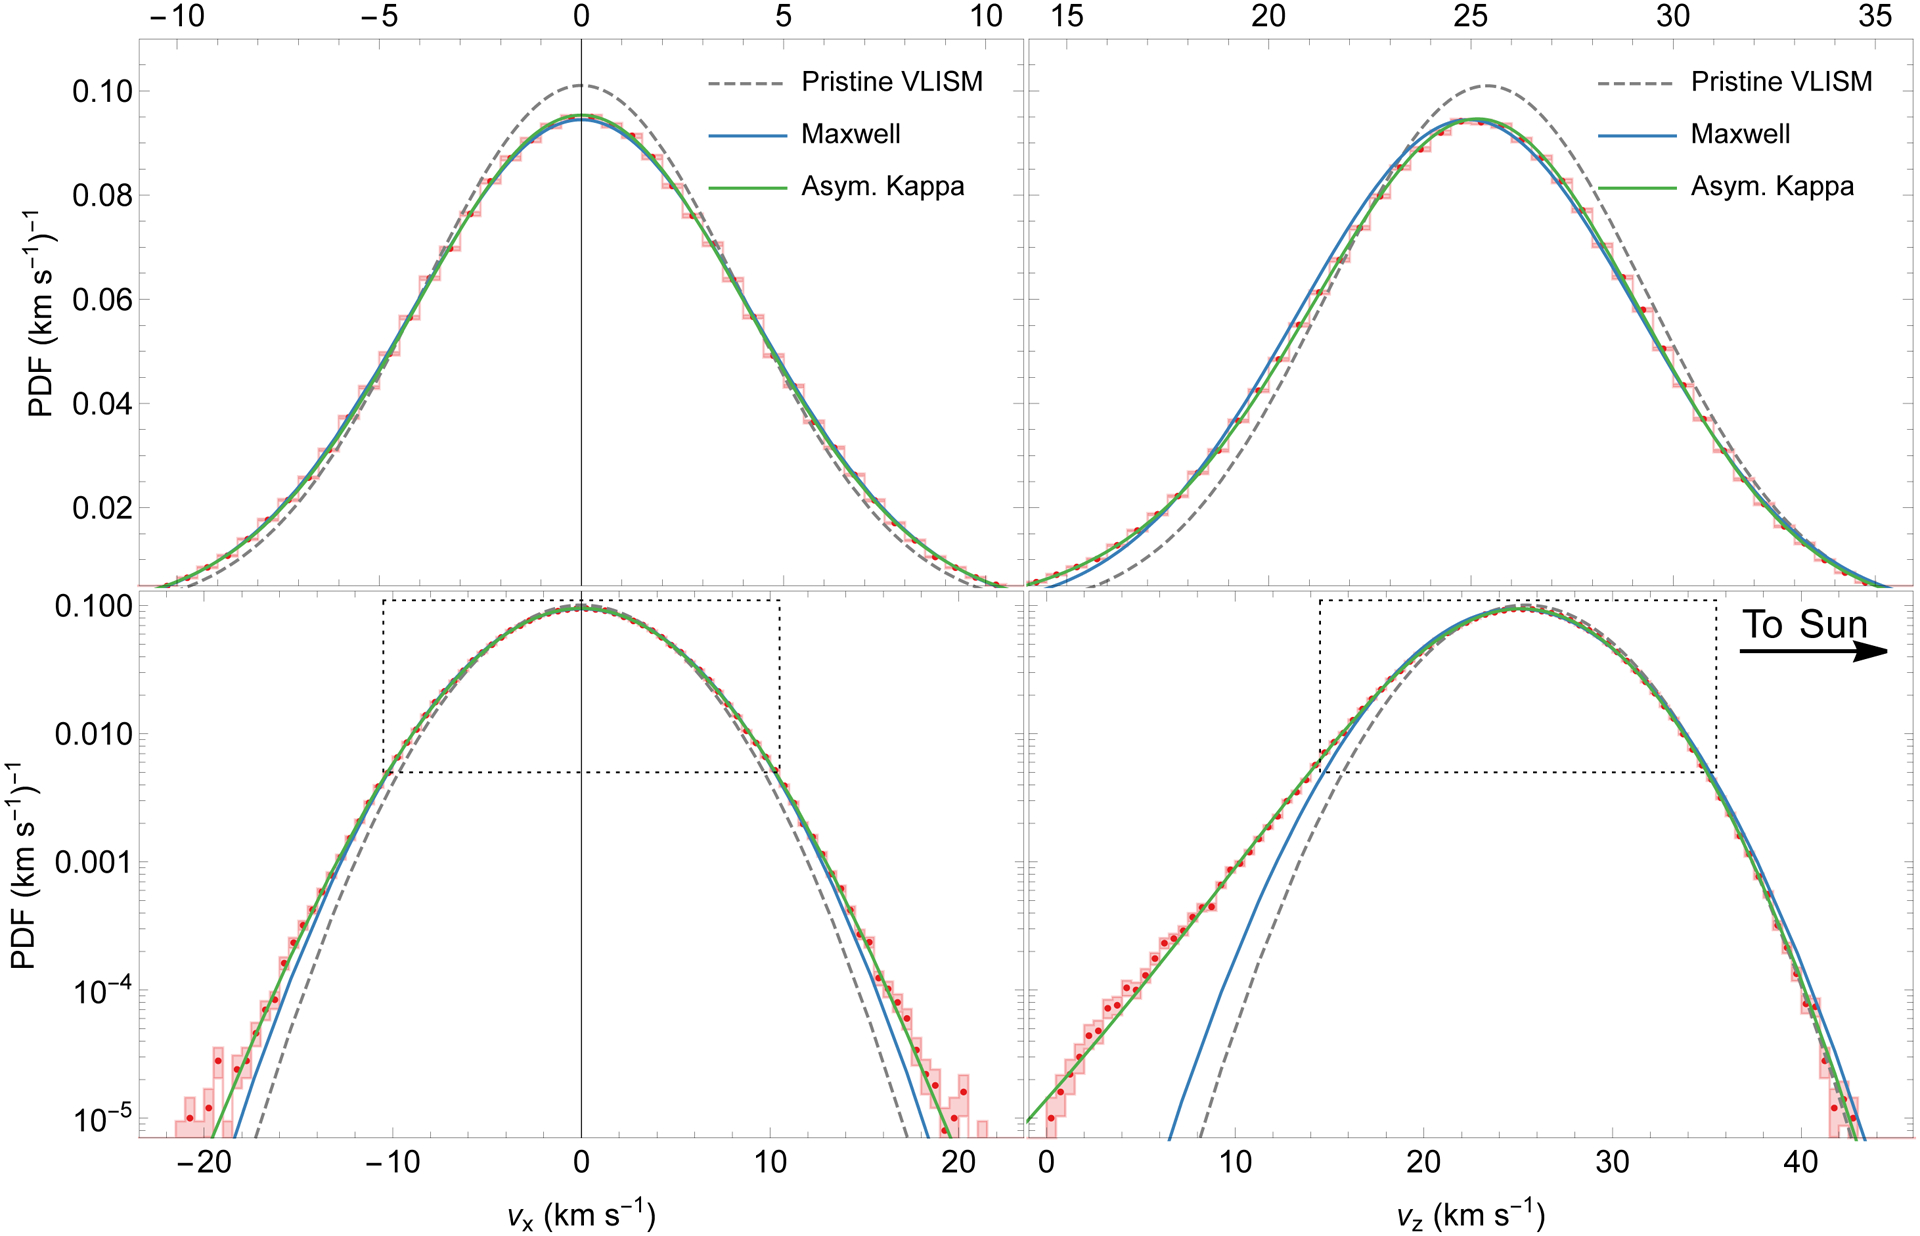
Probability distribution function of the primary ISN helium at the heliopause. The left and right panels show distributions in perpendicular and parallel directions to the inflow direction, respectively. The top panels show part of the distribution marked with dotted boxes in linear scale. The calculated distribution is marked as red histograms with boxes showing bin sizes and method uncertainties. Blue and green lines show the fitted Maxwell and asymmetric kappa distributions. The initial distribution is marked with dashed gray lines.